Download
1 / 42
440 likes | 654 Views
SPSS Session 5: Association between Nominal Variables Using Chi-Square Statistic. Learning Objectives. Review previous statistical tests and how they relate to the levels of measurement for a variable Describe how a Chi-Square test uses cross tabulation

E N D
SPSS Session 5:Association between Nominal Variables Using Chi-Square Statistic
Learning Objectives • Review previous statistical tests and how they relate to the levels of measurement for a variable • Describe how a Chi-Square test uses cross tabulation • Using a table, calculate a Chi-Square statistic • Conduct a Chi-Square analysis and SPSS and interpret the findings
Statistical Tests Review • t-tests • Mean differences between two groups • Uses a t-test statistic • One nominal variable and one interval/ratio variable • ANOVA (Analysis of Variance) • Mean differences between three or more groups • Uses a F-test statistic • One nominal variable and one interval/ratio variable • Correlation • Test of association between two interval/ratio variables • Uses Pearson’s r-values as a correlation coefficient • Tells you the magnitude, direction, and statistical significance of the relationship • Regression • Test of prediction between two interval/ratio variables • Uses a F-test statistic • Helps create a useful equation for prediction of the value in one variable from another
Chi-Square (χ2) Test • The Chi-Square (χ2) test offers a test of association between two nominal/ordinal variables • Social work examples: • Gender and whether or not an individual reports having elevated distress scores or not • Gender and either normal, borderline, or abnormal scores on a measure • Previous involvement in child protection services and whether or not an individual reports having elevated distress scores or not
Cross Tabulation Example 1 • The Chi-Square (χ2) test is best shown through the use of a cross tabulation table • Take for example a table that displays the relationship between gender of the parent/carer and whether or not they reported having elevated distress scores on the GHQ measure • This will be a 2x2 table with each variable having two categories
We can see the following from this table: • 6 men reported normal levels of distress (subclinical) on the GHQ measure • 8 men reported clinically elevated levels of distress on the GHQ measure • 47 women reported normal levels of distress (subclinical) on the GHQ measure • 34 women reported clinically elevated levels of distress on the GHQ measure • There were 14 men and 81 women in the sample • 53 individuals reported normal levels of distress (subclinical) on the GHQ measure • 42 individuals reported clinically elevated levels of distress on the GHQ measure • 95 individuals were in the sample
Cross Tabulation Example 2 • A second example is the relationship between the degree of previous involvement in child protections services and whether or not they reported having elevated distress scores on the GHQ measure • This will be a 3x2 table with degree of previous involvement having three categories
The Chi-Square (χ2) Test Process • The χ2 Test is designed to test for differences between the what was observed and what you would expect if there is no association between the variables • Observed numbers in each category in your table • Expected numbers is the arrangement of the cases in the table if all of the cases were spread evenly across all the categories in the table
Expected vs. Observed Values • Expected values are those in each category if there was no association between your two variables. • Expected values are your null hypothesis, that is no association between the variables • Let’s look at an example
Chi-Square Example 1 • In our child protection study, we later collected information about if cases were referred for child protection services within a year of their closure. • Cases were viewed as successfully closed if there was no later re-referral for additional child protection services. • This information in the “Case_Referral” variable has two categories and is a nominal variable.
Chi-Square Example 1 • We wanted to know if there was an association between whether a parent/carer reported elevated levels of psychological distress and later re-referral for additional child protection services. • We would expect that these variables would be associated (research hypothesis). • Our null hypothesis would be that no significant association exists.
Chi-Square Example 1: Observed Values • Here is the cross tabulation table from this analysis. • These are our observed values
Chi-Square Example 1: Observed Values • If the null hypothesis was true and no association between these variables existed, what would the numbers in the table be?
Chi-Square Example 1: Expected Values • If the null hypothesis was true and no association between these variables existed, these would be the expected values: 27 26 22 20
Chi-Square Example 1: Expected Values • For each category, the numbers are evenly spread across the table as though the null hypothesis was true and no association between the variables exists. 27 26 22 20
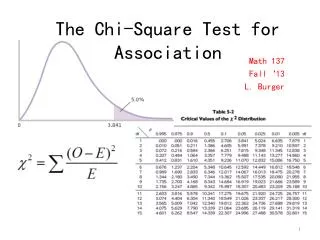
Expected Values in Chi-Square • Expected values for each category are calculated by this formula: E = Expected Frequency R = Marginal Row total C = Marginal Column total N = Total number of cases
27.3 25.7 21.7 20.3 Marginal Totals
Calculating Expected Values Marginal Totals Expected values Subclinical scores and no referral= (53 x 49)/95 = 27.3 Subclinical scores and referral= (53 x 46)/95 = 25.7 Clinical score and no referral = (42 x 49)/95 = 21.7 Clinical score and referral = (42 x 46)/95 = 20.3 27.3 25.7 21.7 20.3
Chi-Square Statistic • The Chi-Square (χ2) assesses the size of the differences between the observed and expected values in a cross tabulation table
Observed values (the actual data) Expected values (if null hypothesis is true) 27.3 25.7 21.7 20.3
Chi-Square Statistic Calculated (33-27.3)2+ (20-25.7)2+ (26-20.3)2+ (16-21.7)2 27.3 25.7 20.3 21.7 32.49 + 32.49 + 32.49 + 32.49 27.3 25.7 20.3 21.7 1.19 + 1.264 + 1.6 + 1.497 X 2 = 5.55
Chi-Square (χ2) Example 1 • We wanted to know if there was an association between whether a parent/carer reported elevated levels of psychological distress and later re-referral for additional child protection services. • We would expect that these variables would be associated (research hypothesis). • Our null hypothesis would be that no significant association exists. • Our χ2= 5.55 is an approximate calculation. • To determine if it is statistically significant and not due to chance, let’s turn to SPSS
Chi-Square (χ2) Example 1: SPSS • From the “Analyze” menu, select “Descriptive Statistics”, and finally “Crosstabs”
Chi-Square (χ2) Example 1: SPSS • Find “GHQ_Cutoff_4” variable which is our variable indicating whether a parent or carer reported clinically elevated GHQ scores • Place this variable in the “Row(s)” list • Find “Case_Referral” variable which indicates whether a case was referred later for additional child protection services • Place this variable in the “Column(s)” list
Chi-Square (χ2) Example 1: SPSS • Within the “Statistics” menu, select “Chi-Square” • Press “Continue”
Chi-Square (χ2) Example 1: SPSS • Within the “Cells” menu, there are plenty of options:
Chi-Square (χ2) Example 1: SPSS • Within the “Cells” menu, there are plenty of options: • Counts: will provide the observed and expected values for the formula we have seen previously • Percentages: will provide all of the percentages per category, marginal totals, or grand total in the analysis which can be useful • For our analysis, just select “Observed” and “Expected” counts for now. • Press “Continue” and then “OK” to conduct analysis
Chi-Square (χ2) Example 1: SPSS • From the new output, we see the new cross tabulation table with the observed and expected values
Chi-Square (χ2) Example 1: SPSS • Finally, we look to the top of the last table for our significance value and the SPSS calculated χ2 value • The χ2value is 5.480, and the significance level is p<.05. It was calculated to be lower than our hand calculation due to rounding error. • There is a statistically significant association between these two nominal/ordinal variables. • We would reject the null hypothesis.
Chi-Square (χ2) Example 1: SPSS • Whether a parent/carer reported elevated GHQ scores was associated with future referrals to additional child protection services (χ2=5.480, df=1, p<.05). • These variables are associated but interpreting the Chi-Square test requires a visual inspection to know where exactly our observed values were different than our expected values.
Look the cross tabulation table, and compare observed and expected values per category • New referrals appeared to be less common in the group of parents/carers reporting lower GHQ scores. • New referrals appeared much more in group with elevated GHQ scores. • With these findings and a statistically significant χ2value, we can assume parent/carer psychological distress was associated with future need for additional child protection services!
Chi-Square (χ2) Example 2 • Now let’s consider the Chi-Square analysis example from earlier. • We wanted to know if the gender of the respondent (parent or carer) was associated with their reporting of elevated GHQ scores or not.
Chi-Square (χ2) Example 2: SPSS • Suppose for a moment that we have no reason to suspect that gender is associated with psychological distress. • Our research hypothesis then would actually be the null hypothesis! • We would hypothesize that gender and elevated psychological distress scores are unrelated. • To demonstrate our research hypothesis, we would hope to fail to reject the null hypothesis.
Chi-Square (χ2) Example 2: SPSS • From the “Analyze” menu, select “Descriptive Statistics”, and finally “Crosstabs”
Chi-Square (χ2) Example 2: SPSS • Find “Gender_Respondent” is the gender of the parent or carer who responded to the family questionnaire • Place this variable in the “Row(s)” list • Find “GHQ_Cutoff_4” variable which is our variable indicating whether a parent or carer reported clinically elevated GHQ scores • Place this variable in the “Column(s)” list
Chi-Square (χ2) Example 2: SPSS • Within the “Statistics” menu, select “Chi-Square” • Press “Continue”
Within the “Cells” menu, select “Observed” and “Expected”, and then “Continue”. • Press “Continue” and then “OK” to conduct analysis
Below is the cross tabulation between the two variables. • Note that the observed values are rather close to the expected values. • This may indicate that there is not much of an association between the variables.
Chi-Square (χ2) Example 2: SPSS • The last table confirms our research hypothesis which was the null hypothesison this occasion. • Gender and reporting of elevated GHQ scores do not have a statistically significant association in our study (χ2= 1.113, df=1, p>.05). The obtained p-value in this analysis was .291, well above our standard of α=.05.