1 / 1

Figure 2 Ranking of burden of disease by YLDs in 1990 and 2010

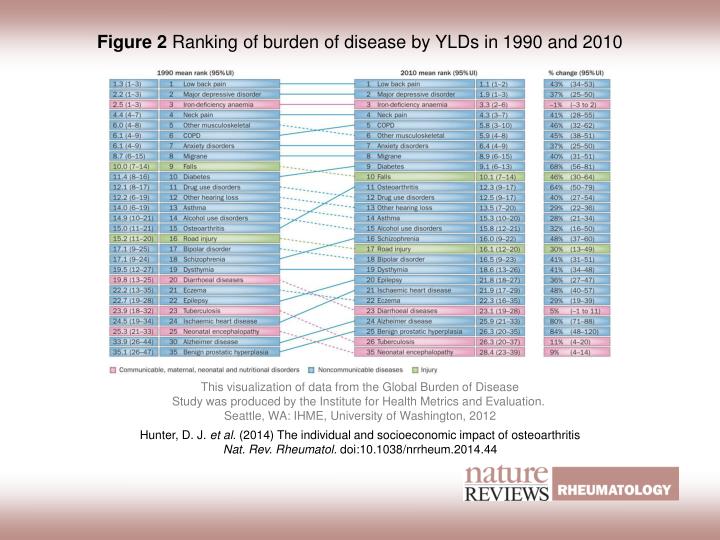
Figure 2 Ranking of burden of disease by YLDs in 1990 and 2010. This visualization of data from the Global Burden of Disease Study was produced by the Institute for Health Metrics and Evaluation. Seattle, WA: IHME, University of Washington, 2012.

haven
Download Presentation

Figure 2 Ranking of burden of disease by YLDs in 1990 and 2010

An Image/Link below is provided (as is) to download presentation Download Policy: Content on the Website is provided to you AS IS for your information and personal use and may not be sold / licensed / shared on other websites without getting consent from its author. Content is provided to you AS IS for your information and personal use only. Download presentation by click this link. While downloading, if for some reason you are not able to download a presentation, the publisher may have deleted the file from their server. During download, if you can't get a presentation, the file might be deleted by the publisher.

E N D

Presentation Transcript


  1. Figure 2 Ranking of burden of disease by YLDs in 1990 and 2010 This visualization of data from the Global Burden of Disease Study was produced by the Institute for Health Metrics and Evaluation. Seattle, WA: IHME, University of Washington, 2012 Hunter, D. J. et al.(2014) The individual and socioeconomic impact of osteoarthritis Nat. Rev. Rheumatol. doi:10.1038/nrrheum.2014.44

More Related