Download
1 / 1
20 likes | 107 Views
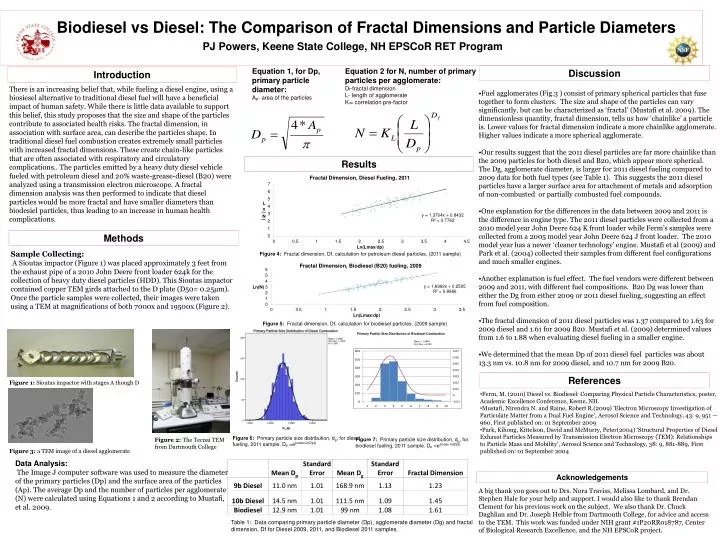
Biodiesel vs Diesel: The Comparison of Fractal Dimensions and Particle Diameters. PJ Powers, Keene State College, NH EPSCoR RET Program. Equation 1, for Dp, primary particle diameter: A p - area of the particles. Equation 2 for N, number of primary particles per agglomerate:

E N D
Biodiesel vs Diesel: The Comparison of Fractal Dimensions and Particle Diameters PJ Powers, Keene State College, NH EPSCoR RET Program Equation 1, for Dp, primary particle diameter: Ap- area of the particles Equation 2 for N, number of primary particles per agglomerate: Df-fractal dimension L- length of agglomerate Kl= correlation pre-factor Discussion Introduction • Fuel agglomerates (Fig.3 ) consist of primary spherical particles that fuse together to form clusters. The size and shape of the particles can vary significantly, but can be characterized as ‘fractal’ (Mustafi et al. 2009). The dimensionless quantity, fractal dimension, tells us how ‘chainlike’ a particle is. Lower values for fractal dimension indicate a more chainlike agglomerate. Higher values indicate a more spherical agglomerate. • Our results suggest that the 2011 diesel particles are far more chainlike than the 2009 particles for both diesel and B20, which appear more spherical. The Dg, agglomerate diameter, is larger for 2011 diesel fueling compared to 2009 data for both fuel types (see Table 1). This suggests the 2011 diesel particles have a larger surface area for attachment of metals and adsorption of non-combusted or partially combusted fuel compounds. • One explanation for the differences in the data between 2009 and 2011 is the difference in engine type. The 2011 diesel particles were collected from a 2010 model year John Deere 624 K front loader while Ferm’s samples were collected from a 2005 model year John Deere 624 J front loader. The 2010 model year has a newer ‘cleaner technology’ engine. Mustafi et al (2009) and Park et al. (2004) collected their samples from different fuel configurations and much smaller engines. • Another explanation is fuel effect. The fuel vendors were different between 2009 and 2011, with different fuel compositions. B20 Dg was lower than either the Dg from either 2009 or 2011 diesel fueling, suggesting an effect from fuel composition. • The fractal dimension of 2011 diesel particles was 1.37 compared to 1.63 for 2009 diesel and 1.61 for 2009 B20. Mustafi et al. (2009) determined values from 1.6 to 1.88 when evaluating diesel fueling in a smaller engine. • We determined that the mean Dp of 2011 diesel fuel particles was about 13.3 nm vs. 10.8 nm for 2009 diesel, and 10.7 nm for 2009 B20. There is an increasing belief that, while fueling a diesel engine, using a biosiesel alternative to traditional diesel fuel will have a beneficial impact of human safety. While there is little data available to support this belief, this study proposes that the size and shape of the particles contribute to associated health risks. The fractal dimension, in association with surface area, can describe the particles shape. In traditional diesel fuel combustion creates extremely small particles with increased fractal dimensions. These create chain-like particles that are often associated with respiratory and circulatory complications.. The particles emitted by a heavy duty diesel vehicle fueled with petroleum diesel and 20% waste-grease-diesel (B20) were analyzed using a transmission electron microscope. A fractal dimension analysis was then performed to indicate that diesel particles would be more fractal and have smaller diameters than biodesiel particles, thus leading to an increase in human health complications. Results Methods Sample Collecting: A Sioutas impactor (Figure 1) was placed approximately 3 feet from the exhaust pipe of a 2010 John Deere front loader 624k for the collection of heavy duty diesel particles (HDD). This Sioutas impactor contained copper TEM girds attached to the D plate (D50= 0.25µm). Once the particle samples were collected, their images were taken using a TEM at magnifications of both 7000x and 19500x (Figure 2). Figure 4: Fractal dimension, Df, calculation for petroleum diesel particles, (2011 sample) Figure 5: Fractal dimension, Df, calculation for biodiesel particles, (2009 sample) Primary Partilcl Size Distribution of Biodiesel Combustion Mean = 1.9638 Std. Dev = 6.252 References Figure 1: Sioutas impactor with stages A though D • Ferm, M. (2010) Diesel vs. Biodiesel: Comparing Physical Particle Characteristics, poster, Academic Excellence Conference, Keene, NH. • Mustafi, Nirendra N. and Raine, Robert R.(2009) 'Electron Microscopy Investigation of Particulate Matter from a Dual Fuel Engine', Aerosol Science and Technology, 43: 9, 951 — 960, First published on: 01 September 2009 • Park, Kihong, Kittelson, David and McMurry, Peter(2004) ‘Structural Properties of Diesel Exhaust Particles Measured by Transmission Electron Microscopy (TEM): Relationships to Particle Mass and Mobility’, Aerosol Science and Technology, 38: 9, 881-889, First published on: 01 September 2004 Figure 6: Primary particle size distribution, dp, for diesel fueling, 2011 sample. Dp =e(mean ln(Dp)) Figure 2: The Tecnai TEM from Dartmouth College Figure 7: Primary particle size distribution, dp, for biodiesel fueling, 2011 sample. Dp =e(mean ln(Dp)) Figure 3: a TEM image of a diesel agglomerate Data Analysis: The Image J computer software was used to measure the diameter of the primary particles (Dp) and the surface area of the particles (Ap). The average Dp and the number of particles per agglomerate (N) were calculated using Equations 1 and 2 according to Mustafi, et al. 2009. Acknowledgements A big thank you goes out to Drs. Nora Traviss, Melissa Lombard, and Dr. Stephen Hale for your help and support. I would also like to thank Brendan Clement for his previous work on the subject. We also thank Dr. Chuck Daghlian and Dr. Joseph Helble from Dartmouth College, for advice and access to the TEM. This work was funded under NIH grant #1P20RR018787, Center of Biological Research Excellence, and the NH EPSCoR project. Table 1: Data comparing primary particle diameter (Dp), agglomerate diameter (Dg) and fractal dimension, Df for Diesel 2009, 2011, and Biodiesel 2011 samples.