Download
1 / 61
610 likes | 618 Views
Using vertebrate genome comparisons to find gene regulatory regions. Ross Hardison and James Taylor Cold Spring Harbor course on Computational Genomics Nov. 10, 2007. Major goals of comparative genomics. Identify all DNA sequences in a genome that are functional

E N D
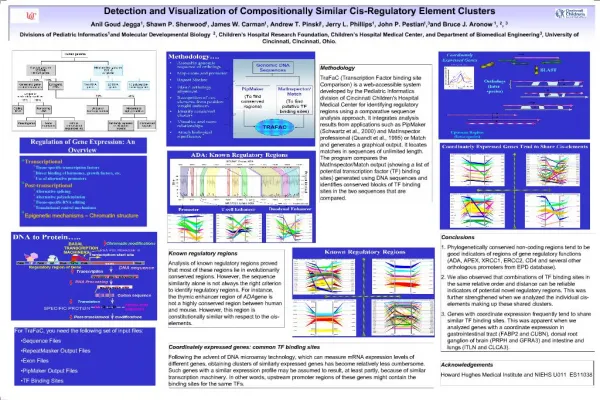
Using vertebrate genome comparisons to find gene regulatory regions Ross Hardison and James Taylor Cold Spring Harbor course on Computational Genomics Nov. 10, 2007
Major goals of comparative genomics • Identify all DNA sequences in a genome that are functional • Selection to preserve function • Adaptive selection • Determine the biological role of each functional sequence • Elucidate the evolutionary history of each type of sequence • Provide bioinformatic tools so that anyone can easily incorporate insights from comparative genomics into their research
Types of sequences in mammalian genomes • About 1.5-2% codes for protein • Almost all shows a sign for purifying selection since the primate-rodent divergence • Does not preclude positive selection acting on smaller regions or in specific lineages • About 45% is interspersed repeats • 22% in ancestral repeats • Good model for neutral DNA • 23% in lineage-specific repeats • About 53% is noncoding, nonrepetitive • Minimum of 4% of genome is under purifying selection for a function common to mammals, but does NOT code for protein • Regulatory sequences • Non-protein coding genes • Other important sequences • About 49% under no obvious selection: no conserved function?
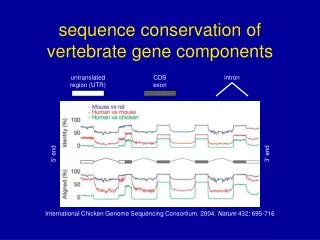
Conserved sequences Better gene predictions Sequences that look like elements that regulate gene expression Impact of whole-genome alignments Guide to functional sequences in the human genome. Sequences under purifying selection
Negative and positive selection observed at different phylogenetic distances :
blastZ: Each segment of human is given the opportunity to align with all mouse sequences. Level 1 chain Level 2 chain Net Genome-wide local alignment chains Human: 2.9 Gb assembly. Mask interspersed repeats, break into 300 segments of 10 Mb. Human Mouse Run blastZ in parallel for all human segments. Collect all local alignments above threshold. Organize local alignments into a set of chains based on position in assembly and orientation.
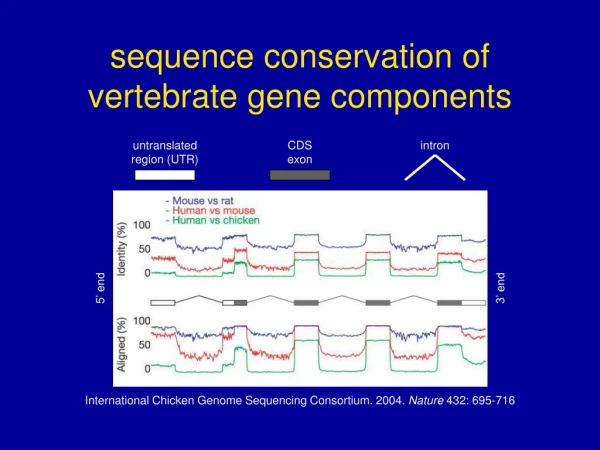
Find common sequences blastZ, multiZ Human Identify functional sequences: ~ 145 Mbp All mammals 1000 Mbp Mouse Rat Also birds: 72Mb Comparative genomics to find functional sequences Genome size 2,900 2,400 2,500 1,200 million base pairs (Mbp) Papers in Nature from mouse and rat and chicken genome consortia, 2002, 2004
Implications of co-variation in divergence • Large regions (megabase sized) are changing relatively fast or slow for (almost) all types of divergence • Neutral substitution, insertions (except SINEs), deletion, recombination • This is a consistent property of each region of genomic DNA • See similar patterns for orthologous regions on independent lineages to mouse, rat and human • An aligned segment with a given similarity score in a fast-changing region is MORE significant than an aligned segments with the same similarity score in a slow-changing region. • Must take the differential rate into account in searching for functional DNA = DNA under selection.
Use measures of alignment quality to discriminate functional from nonfunctional DNA • Compute a conservation score adjusted for the local neutral rate • Score S for a 50 bp region R is the normalized fraction of aligned bases that are identical • Subtract mean for aligned ancestral repeats in the surrounding region • Divide by standard deviation p = fraction of aligned sites in R that are identical between human and mouse m = average fraction of aligned sites that are identical in aligned ancestral repeats in the surrounding region n = number of aligned sites in R Waterston et al., Nature
Decomposition of conservation score into neutral and likely-selected portions Neutral DNA (ARs) All DNA Likely selected DNA At least 5-6% S is the conservation score adjusted for variation in the local substitution rate. The frequency of the S score for all 50bp windows in the human genome is shown. From the distribution of S scores in ancestral repeats (mostly neutral DNA), can compute a probability that a given alignment could result from locally adjusted neutral rate. Waterston et al., Nature
Conservation score S in different types of regions Red: Ancestral repeats (mostly neutral) Blue: First class in label Green: Second class in label
phastCons: Likelihood of being constrained • Phylogenetic Hidden Markov Model • Posterior probability that a site is among the 10% most highly conserved sites • Allows for variation in rates along lineages c is “conserved” (constrained) n is “nonconserved” (aligns but is not clearly subject to purifying selection) Siepel et al. (2005) Genome Research 15:1034-1050
Larger genomes have more of the constrained DNA in noncoding regions Expected value if coverage by conserved elements is uniform Siepel et al. 2005, Genome Research
Some constrained introns are editing complementary regions:GRIA2 Siepel et al. 2005, Genome Research
3’UTRs can be highly constrained over large distances 3’ UTRs contain RNA processing signals, miRNA targets, other regions subject to constraints Siepel et al. 2005, Genome Research
Ultraconserved elements = UCEs • At least 200 bp with no interspecies differences • Bejerano et al. (2004) Science 304:1321-1325 • 481 UCEs with no changes among human, mouse and rat • Also conserved between out to dog and chicken • More highly conserved than vast majority of coding regions • Most do not code for protein • Only 111 out of 481overlap with protein-coding exons • Some are developmental enhancers. • Nonexonic UCEs tend to cluster in introns or in vicinity of genes encoding transcription factors regulating development • 88 are more than 100 kb away from an annotated gene; may be distal enhancers
GO category analysis of UCE-associated genes • Genes in which a coding exon overlaps a UCE • 91 Type I genes • RNA binding and modification • Transcriptional regulation • Genes in the vicinity of a UCE (no overlap of coding exons) • 211 Type II genes • Transcriptional regulation • Developmental regulators Bejerano et al. (2004) Science
Pennacchio et al., http://enhancer.lbl.gov/ Intronic UCE in SOX6 enhances expression in melanocytes in transgenic mice UCEs Tested UCEs
The most stringently conserved sequences in eukaryotes are mysteries • Yeast MATa2 locus • Most conserved region in 4 species of yeast • 100% identity over 357 bp • Role is not clear • Vertebrate UCEs • More constrained than exons in vertebrates • Noncoding UCEs are not detectable outside chordates, whereas coding regions are • Were they fast-evolving prior to vertebrate/invertebrate divergence? • Are they chordate innovations? Where did they come from? • Role of many is not clear; need for 100% identity over 200 bp is not obvious for any • What molecular process requires strict invariance for at least 200 nucleotides? • One possibility: Multiple, overlapping functions
Going beyond stringent selection in noncoding sequence to find cis-regulatory modules
Constraint in noncoding sequences • Used to predict gene regulatory regions with some success • Some sequences conserved between humans and mouse show no apparent function • Is constraint revealing many false positives? • Sequences regulating gene expression in restricted lineages are not constrained across mammals • Is pan-mammalian constraint missing many functional sequences? Tree from Margulies et al. (2007) Genome Res.
phastCons can find some but not all gene regulatory regions LCR HS1 HS2 HS3 HS4 HS5 phastCons Locus control region, or LCR, is the major distal enhancer fo HBB and related, linked genes. It has 5 DNase hypersensitive sites covering about 20 kb.
Two extremes of constraint in CRMs CRMs= cis-regulatory modules. DNA sequences needed in cis for regulation of expression, usually transcription E.g. promoters, enhancers, silencers
5% Coverage of human by alignments with other vertebrates ranges from 1% to 91% Human 5.4 Millions of years 91 92 173 220 310 360 450
Distinctive divergence rates for different types of functional DNA sequences pTRRs: putative transcriptional regulatory region; likely CRMs Sites identified as occupied by sequence-specific transcription factors based on high-throughput chromatin immunoprecipitation assayed by hybridization to high density tiling arrays of genomic DNA= ChIP-chip
cis-Regulatory modules conserved beyond mammals • Human-chicken alignment capture about 6% of pTRRs (likely CRMs) • Human-fish alignments capture about 3% of pTRRs. • The pan-vertebrate CRMs tend to regulate genes whose products control transcription and development Millions of years 91 173 310 450
cis-Regulatory modules conserved in eutherian mammals and marsupials • Human-marsupial alignments capture about 32% of CRMs (pTRRs) • Tend to occur close to genes involved in aminoglycan synthesis, organelle biosynthesis • Human-mouse alignments capture about 75% of CRMs (pTRRs) • Tend to occur close to genes involved in apoptosis, steroid hormone receptors, etc. • Within aligned noncoding DNA of eutherians, need to distinguish constrained DNA (purifying selection) from neutral DNA. Millions of years 91 173 310 450
Expected properties of gene regulatory regions • Can be almost anywhere • 5’ or 3’ to gene • Within introns • Close or far away • Conserved between species (sometimes) • Examine interspecies alignments, noncoding regions • Evaluate likelihood of being under purifying selection, e.g. phastCons score • Some regulatory regions are deeply conserved, others are lineage-specific • Enhancers and promoters: clusters of binding sites for transcription factors (TFBSs) • Resources and servers for finding TFBSs • TRANSFAC http://www.gene-regulation.com/ • JASPAR http://jaspar.cgb.ki.se/cgi-bin/jaspar_db.pl • TESS http://www.cbil.upenn.edu/cgi-bin/tess/tess • MOTIF (GenomeNet) http://motif.genome.jp/ • MatInspector http://www.genomatix.de/
Finding known motifs in a query sequence MatInspector at http://www.genomatix.de/ K. Cartharius et al. (2006) MatInspector and beyond: promoter analysis based on transcription factor binding sites. Bioinformatics 21:2933-2942. Genomatix Software GmbH, Munchen, Germany Query: a UCE in SOX6 1356 bp About 1 in 4 bp is the start of a TFBS match!
Conservation of TFBSs between species • Servers to find conserved matches to factor binding sites • Comparative genomics at Lawrence Livermore http://www.dcode.org/ • zPicture and rVista • Mulan and multiTF • ECR browser • Consite http://mordor.cgb.ki.se/cgi-bin/CONSITE/consite • Conserved TFBSs are available for some assemblies of human genome at UCSC Genome Browser Binding site for GATA-1
Clusters of conserved TFBSs: PReMods http://genomequebec.mcgill.ca/PReMod/ Blanchette et al. (2006) Genome Research
ESPERREvolutionary and Sequence Pattern Extraction through Reduced Representation
ESPERR: a different approach • Don’t assume a database of known binding motifs • Don’t assume strict conservation of the important sequence signals • Instead, use alignments of validated examples to learn sequence and evolutionary patterns that characterize a class of elements
Group columns using evolutionary similarity and frequency distribution
Good performance of ESPERR for gene regulatory regions (RP) -1