Download
1 / 44
440 likes | 444 Views
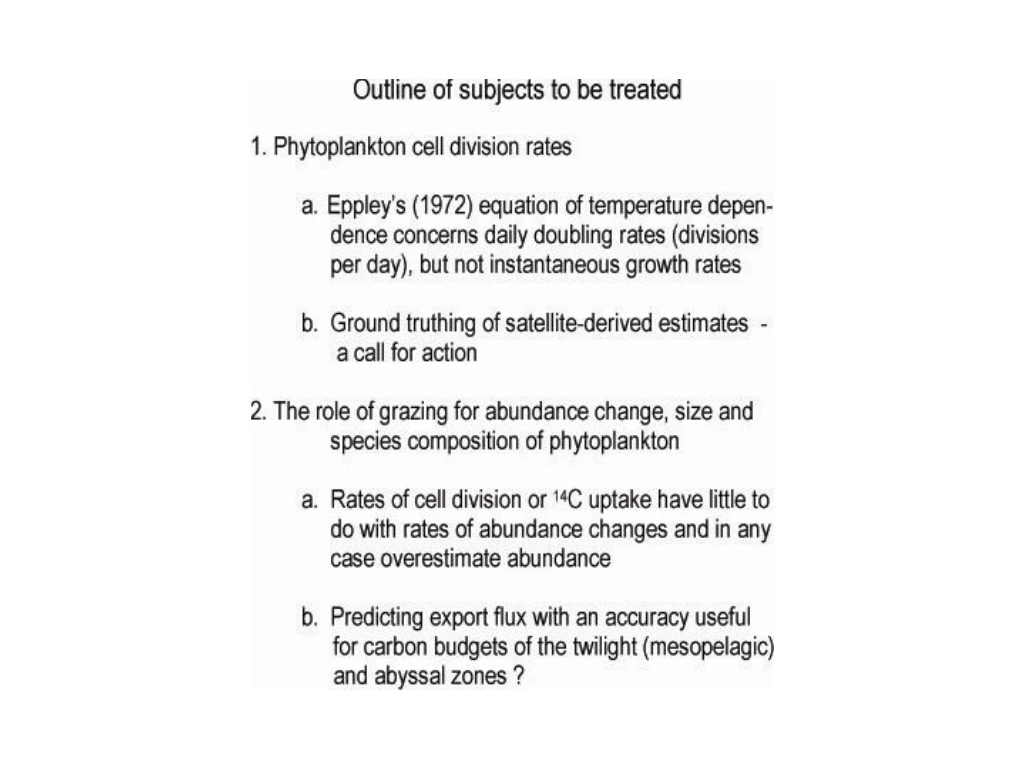
Variation in the specific growth rate ( µ ) of photoautotrophic unicellular algae with temperature under continuous light (from Eppley, 1972). Data are all for laboratory cultures. Growth rate is expressed in doublings/day. (from Eppley, 1972).

E N D
Variation in the specific growth rate (µ) of photoautotrophic unicellular algae with temperature under continuous light (from Eppley, 1972). Data are all for laboratory cultures. Growth rate is expressed in doublings/day.
Growth rates of bulk phytoplankton from dilution experiments on temperature at ample irradiance without added nutrients, µo. (A) Offshore Arabian Sea and subtropical E. Atlantic. (collated by Banse, unpubl.) Filled symbols, in situ ≥ 1.2 µM NO3– or DIN; open symbols with less nitrogen (mostly with very little). Small circles and inverted triangles, SWM and NEM, respectively, from Landry et al., 1998, DSR II 45: 2353, Tables 1 and 2, 5-30 m. Upright triangles and squares, NEM and SpringIM, respectively, from Caron & Dennett, 1999, DSR II 46: 1665, Tables 1 and 2, 5-25m. Circled values, samples with sufficient ambient Fe as inferred from Barber et al., 2001, DSR II 48: 1163. (Inshore stations S1 and N1 omitted.) Diamonds, Kuedo & Anadhu, 2001, MEPS 221: 29, 5-10 m, Extreme oligotrophic subtropical E. Atlantic.
Growth rates of bulk phytoplankton from dilution experiments on temperature at ample irradiance without added nutrients, µo. (B) Offshore Equatorial Pacific in HNLC regions. (collated by Banse, unpubl.) Upright triangles, EqPac Survey Cruise, 2˚N to 2˚S along 140˚W in February-March and August-September 1992 (Landry et al., 1995, DSR II 42: 657, Tables 1 and 2, 10 and 20 m). The former period during El Niño and more Fe-limited than the second period (Barber et al., 1999, ibid., 46: 960). Square, Equator, 125˚W (Chavez et al., 1991, L & O 36: 1816. Surface temperature estimated from Fig. 1).
Stations from panels (A) and (B), plus additional ones, all from dilution experiments with added nutrients (µn). (Besides bound N and P, Fe [“with”] or without iron added [“w/o”]. (collated by Banse, unpubl.) Inverted triangles, IronExII (with Fe) from inside the fertilized patch read from Banse, 2002, Hydrobiol. 480: 15, Fig. 3B, based on Landry’s raw data, 15 m. Temperature estimated from Coale et al., 1994, Nature 383: 494, Fig. 2. — Dots, (a) EqPac Survey Cruises (nutrients with Fe), Landry et al. (stations as in panel B, upright triangles). (b) Time series stations in April and October 1992 at 25-29˚ (nutrients w/o Fe), Verity et al., 1996, DSR II 43: 1227, Tables 6 and 7, 15 m. — Upright crosses, Arabian Sea (nutrients with Fe), Landry et al. (stations as in panel A, circles and inverted triangles). — Lying crosses, Arabian Sea (nutrients w/o Fe), Caron & Dennett (stations as in panel A, upright triangles and squares). — Circled values, phytoplankton growing with sufficient Fe prior to being enclosed for the 24-h dilution experiments, and hence more likely to have been in balanced growth than those exposed to macronutrients and Fe just during the experiments. Arrows on the right-hand margins, median divisions per day for (1), Arabian Sea, SWM (1.93 d-1, n=21). (2), Arabian Sea, NEM (1.65 d-1, n=19, small circles and inverted trialgles, respectively, in panel A; both as upright crosses in panel C). (3) Arabian Sea, NEM and SIM (1.46 d-1, n=17, upright triangles and squares, respectively, in panel A; lying crosses in panel C). (4) EqPac data (1.36 d-1, n=18, dots). (1) and (2) do not differ, (2) and (3) differ at p=0.01, while (3) and (4) do not differ.
IronEx II, 1995, west of Galapagos Islands (modified from Banse, 2000). (Note that the open triangle in Day 152, below 1000 mg C, must be filled.)
The composition of the crustacean zooplankton of Crystal Lake (Connecticut) before and after Alosa aestivalis (alewife, a fish feeding on zooplankton) had become well established. (from Brooks & Dodson, 1965)
Pt = Po(k – m) • AFTER DILUTION BY, e.g., 50% ( =0.5) • Pt = 0.5 Po(k – 0.5m)
(m is the slope of the line. Modified from Landry et al., 1995.)
Division rates of algal species in cultures as dependent on temperature with the “standard curve” for optimal growth (Eppley, 1972) and half of this maximum (broken curve) added. Filled symbols—24 h of light; other with estimated daylengths (h) (modified from Banse, 1991).
Seasonal variations in the populations of filter feeders in Lund Enclosure A, during 1978. (Reynolds, 1984)
Oxygen minimum zone, central Arabian Sea. Captions in lower parts of panels, squares, broken regression lines, southwest monsoon; captions in upper parts of panels, circles, full lines, northeast monsoon. (Banse et al., in prep.)
Translation of L I Sazhina (1985) Nauplii of Mass Species of Pelagic Copepods of the World Ocean. Naukova Dumka, Kiev, 237 pp. with 100 plates with ca. 1400 figures