Download
1 / 53
530 likes | 694 Views
EU-wetlands: Hotspots for GHG-emission?. Matthias Drösler, TUM, DE & Elmar Veenendaal, WUR, NL. Part 1: based on the CARBOEUROPE sysnthesis study EU-Peatlands: Current carbon stocks and trace gas exchange

E N D
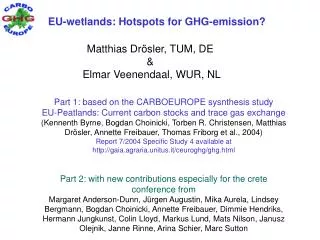
EU-wetlands: Hotspots for GHG-emission? Matthias Drösler, TUM, DE & Elmar Veenendaal, WUR, NL Part 1: based on the CARBOEUROPE sysnthesis study EU-Peatlands: Current carbon stocks and trace gas exchange (Kennenth Byrne, Bogdan Choinicki, Torben R. Christensen, Matthias Drösler, Annette Freibauer, Thomas Friborg et al., 2004) Report 7/2004 Specific Study 4 available at http://gaia.agraria.unitus.it/ceuroghg/ghg.html Part 2: with new contributions especially for the crete conference from Margaret Anderson-Dunn, Jürgen Augustin, Mika Aurela, Lindsey Bergmann, Bogdan Choinicki, Annette Freibauer, Dimmie Hendriks, Hermann Jungkunst, Colin Lloyd, Markus Lund, Mats Nilson, Janusz Olejnik, Janne Rinne, Arina Schier, Marc Sutton
EU-peatlands: Hotspots for GHG-emission? Drösler & Veenendaal wetland swamp non-peatforming fresh-water peatland marsh non-peatforming salt-water influenced bog (ombro- trophic) fen (minero- trophic) used natural used mire after Joosten & Clarke 2002
EU-peatlands: Hotspots for GHG-emission? Drösler & Veenendaal peatlands Carbon stock 270-450 Pg C ~ 1/5 – 1/3 of world soil carbon ~ 1/2 of CO2-C of the atmosphere ~ just 3% of the surface
EU-peatlands: Hotspots for GHG-emission? Drösler & Veenendaal Mire, a peatland where peat is currently being formed Total mire area* 1. Russia European part 15.00 Mha 2. Sweden 5.50 3. Finland 4.50 4. Norway 2.20 5. Belarus 1.14 6. Ukraine 0.58 7. Latvia 0.47 8. Iceland 0.35 9. Estonia 0.30 10. Ireland 0.21 (11. Poland 0.20) (12. United Kingdom 0.10) Top 10 in Europe – 2002 area based Peatland, area with or without vegetation with a naturally accumulated peat layer at the surface, including mires drained for forestry, agriculture, horticulture and energy production 1. Russia European part 21.30 Mha 2. Finland 8.50 3. Sweden 6.60 4. Norway 2.80 5. Belarus 2.35 6. United Kingdom 1.75 7. Germany 1.30 8. Poland 1.25 9. Ireland 1.15 10. Estonia 1.00 Total peatland area* *Source: Wise use of mires and peatlands, background and principles including a framework for decision-making, 2002, edited by H. Joosten and D.Clarke.
Emission factorsfor CO2, CH4 and N2O FEN BOG PEAT CUT
EU-peatlands: Hotspots for GHG-emission? Drösler & Veenendaal n=7 n=2 n=1 n=1 n=2 n=4 n=9 n=16 forest arable natural peat cut restored drainage grassland abandoned
EU-peatlands: Hotspots for GHG-emission? Drösler & Veenendaal n=20 n=7 n=60 n=2 n=15 n=1 n=1 n=2 n=4 n=1 n=9 n=2 n=16 n=10 forest arable natural peat cut restored drainage grassland abandoned
EU-peatlands: Hotspots for GHG-emission? Drösler & Veenendaal n=14 n=2 n=1 n=9 n=4 n=5 n=16 n=9 forest arable natural peat cut restored drainage grassland abandoned
EU-peatlands: Hotspots for GHG-emission? Drösler & Veenendaal n=14 n=13 n=13 n=2 n=1 n=2 n=9 n=4 n=2 n=5 n=16 n=4 n=7 n=9 forest arable natural peat cut restored drainage grassland abandoned
EU-peatlands: Hotspots for GHG-emission? Drösler & Veenendaal n=8 n=5 n=1 n=11 n=4 n=5 n=12 n=6 forest arable natural peat cut restored drainage grassland abandoned Source + Sink -
EU-peatlands: Hotspots for GHG-emission? Drösler & Veenendaal n=8 n=4 n=5 n=5 n=1 n=3 n=11 n=4 n=0 n=5 n=12 n=4 n=6 n=4 forest arable natural peat cut restored drainage grassland abandoned Source + Sink -
EU-peatlands: Hotspots for GHG-emission? Drösler & Veenendaal forest arable natural peat cut restored drainage grassland abandoned
EU-peatlands: Hotspots for GHG-emission? Drösler & Veenendaal 1 2 3 4 5 6 7 10 8 9 12 13 1 arable (fen) 2 grassland (fen) 3 arable (bog) 4 abandoned after peat cut (bog) 5 grassland (bog) 6 peat cut (bog) 7 drainage (bog) 8 restoration (bog) 9 drainage (fen) 10 natural (fen) 11 restoration (fen) (but without NEE!) 12 natural (bog) 13 forest (fen) 14 forest (bog) 11 14
EU-peatlands: Hotspots for GHG-emission? Drösler & Veenendaal Out of 43 European countries the ten biggest peatland emitters are contributing 46300 Gg CO2-C equivalents or 90% of total European GHG emissions from peatlands. Less than half these emissions are from EU-25.
EU-peatlands: Hotspots for GHG-emission? Drösler & Veenendaal Significance For EU-25 the significance of peatland GHG emissions is about 2-3% of anthropogenic emissions. For Germany peatland emissions represent 2.3-4.5 % of the anthropogenic emissions and are a major source in the land sector. So even in a highly industrialized country like Germany peatland emissions are a hotspot.
EU-peatlands: Hotspots for GHG-emission? Drösler & Veenendaal Sources for the EU-peatlands GHG-exchange compilation: Alm et al. (1999); Augustin et al. (1996); Augustin et al. (1998 a); Augustin et al. (1998 b) ; (Augustin 2001); Aurela (2002); Dörsch et al. (inprep) ; Drösler (2005); Flessa et al. (1998); Friborg (unpubl.); Glatzel et al. (2003); Glatzel & Stahr (2002); Harding et al. (2001); Heikkinen et al. (2002); Hillebrand (1993); Höper & Blankenburg (2000); Jaakkola (1985); Joosten & Clark (2002); Kasimir Klemedtsson (1997); Klemedtsson (1997) ; Komulainen et al. (1998); Laine & Minkkinen (1996) ; Laine et al. (1996) ; Langenveld etal. (1997); Lustra ( 2002); Maljanen et al. (2001); Martikainen et al. (1993) ; Martikainen (1995) ; Meyer (1999) ; Minkkinen et al. (2002) ; Mundel (1976) ; Nilsson et al. (2001); Nykänen et al. (1995) ; Nykänen et al. (1998); Regina et al. (1996); Silvola (1986); Sundh et al. (2000); Tuittila (2000); Van den Pol-van Dasselaar (1999); Velthof & Oenema (1993); Velthof & Oenema (1995); Velthof et al. (1996); Weslien et al. (in prep.); Report 7/2004 Specific Study 4 available at http://gaia.agraria.unitus.it/ceuroghg/ghg.html
EU-peatlands: Hotspots for GHG-emission? Drösler & Veenendaal n=8 n=5 n=1 n=11 n=4 n=5 n=12 n=6 forest arable natural peat cut restored drainage grassland abandoned Tadham Moor, temperate, UK, 2002 Lloyd, 2006
EU-peatlands: Hotspots for GHG-emission? Drösler & Veenendaal n=8 n=5 n=1 n=11 n=4 n=5 n=12 n=6 forest arable natural peat cut restored drainage grassland abandoned Tadham Moor, temperate, UK, 2002 Lloyd, 2006 Fäjemyr, temperate, SE, 2005 Lund et al.
EU-peatlands: Hotspots for GHG-emission? Drösler & Veenendaal n=8 n=5 n=1 n=11 n=4 n=5 n=12 n=6 forest arable natural peat cut restored drainage grassland abandoned Tadham Moor, temperate, UK, 2002 Lloyd, 2006 Fäjemyr, temperate, SE, 2005 Lund et al. Auchencorth, temperate, UK semi-natual very low sheep grasing intensity 2003 -6 g C 2004 +3 g C Andersen et al.
EU-peatlands: Hotspots for GHG-emission? Drösler & Veenendaal n=14 n=13 n=13 n=2 n=1 n=2 n=9 n=4 n=2 n=5 n=16 n=4 n=7 n=9 forest arable natural peat cut restored drainage grassland abandoned
EU-peatlands: Hotspots for GHG-emission? Drösler & Veenendaal EU- average (till 2004) n=4 Rzecin PL,2004 temp. Olejnik, 2005 Siikaneva FI, boreal Rinne,et al. 2005 Kaamanen FI, subarctic Hargreaves, et al. 1 a ave
EU-peatlands: Hotspots for GHG-emission? Drösler & Veenendaal Peenetal DE, temp 2005 Augustin et al.in prep Oukoop, NL,temp 2005/6 Schrier et al in prep. Donauried DE, temp 2005 Freibauer et al. in prep. EU- average (till 2004) n=13 Stein, NL,temp 2005/6 Schrier et al in prep.
EU-peatlands: Hotspots for GHG-emission? Drösler & Veenendaal Peenetal DE, temp 2005 Augustin et al. In prep Oukoop, NL,temp 2005/6 Schrier et al in prep. Donauried DE, temp 2005 Freibauer et al. in prep. EU- average (till 2004) n=13 Stein, NL,temp 2005/6 Schrier et al in prep.
EU-peatlands: Hotspots for GHG-emission? Drösler & Veenendaal Peenetal, DE, 2005 1st year after restoration Augustin & Choinicki EU- average (till 2004) n=2 Horstermeer, NL, 2005 12 years after restoration, Hendriks et al. Donauried, DE, 2005 25 years after restoration Freibauer et al.
EU-peatlands: Hotspots for GHG-emission? Drösler & Veenendaal Peenetal, DE, 2005 1st year after restoration Augustin & Choinicki EU- average (till 2004) n=2 Horstermeer, NL, 2005 12 years after restoration, Hendriks et al. Donauried, DE, 2005 25 years after restoration Freibauer et al. 0 - 5 - 5 - 10 < - 10 mean WT (cm): 0
EU-peatlands: Hotspots for GHG-emission? Drösler & Veenendaal Peenetal, DE, 2005 1st year after restoration Augustin & Choinicki EU- average (till 2004) n=2 Horstermeer, NL, 2005 12 years after restoration, Hendriks et al. Donauried, DE, 2005 25 years after restoration Freibauer et al. 0 - 5 - 5 - 10 < - 10 mean WT (cm): 0
EU-peatlands: Hotspots for GHG-emission? Drösler & Veenendaal EU- average (till 2004) n=4 Rzecin PL, temp. Olejnik, 2004 Degerö Stomyr, SE, boreal Nilsso, 2004-2005 Siikaneva FI, boreal Aurela, 2005 Kaamanen FI, subarctic Aurela, 6 a ave
EU-peatlands: Hotspots for GHG-emission? Drösler & Veenendaal GPP= -1462 -1528 -1560 Reco= 1548 1520 2070 EU- average (till 2004) n=5 Oukoop, Stein NL, temp. NL, temp 2004/05 Veenendaal et al., in prep. Donauried, DE, temp. 2005 Drösler et al. in prep.
EU-peatlands: Hotspots for GHG-emission? Drösler & Veenendaal Peenetal, DE, 2005 1st year after restoration Augustin & Choinicki EU- average (till 2004) n=0 Horstermeer, NL, 2005 12 years after restoration, Hendriks et al. Donauried, DE, 2005 25 years after restoration Drösler et al.
EU-peatlands: Hotspots for GHG-emission? Drösler & Veenendaal Peenetal, DE, temperate 2005, 1st year after restoration Horstermeer, NL, temperate, 2005 10+ years after restoration Rzecin PL, temperate, 2005, natural Donauried, DE, temperate, 2005 25 years after restoration Siikaneva, FI, boreal, 2005, natural Kaamanen, FI, subarctic 6a average, natural Stein, NL, temperate, 2005, grassland extensive man. Oukoop, NL, temperate 2005, grassland intensive man.
EU-peatlands: Hotspots for GHG-emission? Drösler & Veenendaal Peenetal, DE, fen, temperate 2005, 1st year after restoration Horstermeer, NL, fen, temperate, 2005 10+ years after restoration Rzecin PL, fen, temperate, 2004, natural Donauried, DE, fen, temperate, 2005 25 years after restoration Siikaneva, FI, fen boreal, 2005, natural Kaamanen, FI, fen, subarctic 6a average, natural Stein, NL, fen, temperate, 2005, grassland extensive man. Oukoop, NL, fen, temperate 2005, grassland intensive man.
EU-peatlands: Hotspots for GHG-emission? Drösler & Veenendaal relation of CH4-C balances with CO2-C balances Kendlmühlfilze, DE, bog, temperate r2= 0.87, p<0.001 Drösler 2005
EU-peatlands: Hotspots for GHG-emission? Drösler & Veenendaal 1 2 3 4 5 6 7 10 8 9 11 12 13 14 1 arable (fen) 2 grassland (fen) 3 arable (bog) 4 abandoned after peat cut (bog) 5 grassland (bog) 6 peat cut (bog) 7 drainage (bog) 8 restoration (bog) 9 drainage (fen) 10 natural (fen) 11 restoration (fen) (but without NEE!) 12 natural (bog) 13 forest (fen) 14 forest (bog)
EU-peatlands: Hotspots for GHG-emission? Drösler & Veenendaal Peenetal, DE, temperate 2005, 1st year after restoration Horstermeer, NL, temperate, 2005 10 years after restoration Rzecin PL, temperate, 2004 natural Donauried, DE, temperate, 2005 25 years after restoration Siikaneva, FI, boreal, 2005, natural Kaamanen, FI, subarctic 6a average, natural Stein, NL, temperate, 2005, grassland extensive man. Oukoop, NL, temperate 2005, grassland intensive man.
EU-peatlands: Hotspots for GHG-emission? Drösler & Veenendaal Peenetal, DE, temperate 2005, 1st year after restoration Horstermeer, NL, temperate, 2005 10 years after restoration Carbon sequestration Rzecin PL, temperate, 2004 natural Climate mitigation Donauried, DE, temperate, 2005 25 years after restoration Siikaneva, FI, boreal, 2005, natural Kaamanen, FI, subarctic 6a average, natural Stein, NL, temperate, 2005, grassland extensive man. Oukoop, NL, temperate 2005, grassland intensive man.
EU-peatlands: Hotspots for GHG-emission? Drösler & Veenendaal Peenetal, DE, temperate 2005, 1st year after restoration Horstermeer, NL, temperate, 2005 10 years after restoration Carbon sequestration Rzecin PL, temperate, 2004 natural Donauried, DE, temperate, 2005 25 years after restoration Climate mitigation Siikaneva, FI, boreal, 2005, natural Kaamanen, FI, subarctic 6a average, natural Stein, NL, temperate, 2005, grassland extensive man. Oukoop, NL, temperate 2005, grassland intensive man.
EU-peatlands: Hotspots for GHG-emission? Drösler & Veenendaal Peenetal, DE, temperate 2005, 1st year after restoration Horstermeer, NL, temperate, 2005 10 years after restoration Rzecin PL, temperate, 2004 natural Donauried, DE, temperate, 2005 25 years after restoration Siikaneva, FI, boreal, 2005, natural ? Kaamanen, FI, subarctic 6a average, natural Stein, NL, temperate, 2005, grassland extensive man. Oukoop, NL, temperate 2005, grassland intensive man.
EU-peatlands: Hotspots for GHG-emission? Drösler & Veenendaal Conclusions • Spatial variability matters: • water table • vegetation type • management • peat characteristics • ….. • Peatland-Landscape composed by a small scale mosaic of parameter combinations => specific requirements for site selection, measurement techniques and upscaling approaches • Temporal variability matters: • interannual variability • time since restoration • Multiyear measurement programmes and/or revisiting of sites required
EU-peatlands: Hotspots for GHG-emission? Drösler & Veenendaal German BMBF-funded project within the programme on climate mitigation: GHG-exchange at 6 sites across german peatland regions Partners: TUM (coordination) IÖW LBEG MPI ZALF associated via EU-TOK: University of Poznan Rzecin-site Map from Schopp-Guth (1999) 2004-10 2006-10 2006-10 2006-10 2006-10 2005 2006-10 1999/00 2006-10 2006
Fen meadow landscapescale experiment: Netherlands Horstermeer Nature Reserve Water level -10 cm Institute(s) : Free University Wageningen University ECN Petten, TNO MEP Oukoop Intensive dairy farm Mown in winter Water level -60 cm Stein Meadow bird reserve Mown in winter Water level -60 cm Being raised to –20 cm dynamic level
EU-peatlands: Hotspots for GHG-emission? Drösler & Veenendaal further needs • Only few year round GHG budgets based on continuous measurements for peatlands. • Representation of different climate zones up to now only limited. • Peat depths and bulk density profiles are not well-known in much of Europe, and are a key item in calculating current carbon stocks and long term accumulation rates. • There is particular need for more data about GHG budgets of peatlands under particular land uses: a) bog: grassland, cropland, land abandoned after peat cut, restoration, forest chronosequences, N2O fluxes in general. b) fen: abandoned after harvest, restoration, CO2 fluxes in general. General: differentiation of intensity. • There are insufficient data to characterize greenhouse gas flux sensitivity from peatlands to the full potential of weather variability and climate change. • The assessment of restoration effects on GHG-fluxes needs more measurement programs and process studies, to cover variability in time and space.
Messung von CO2, CH4 und N2O Flüssen auf unterschiedlichen Skalen: Eddy-Kovarianz, automatische und manuelle Hauben
Aggregated land-cover types and peatland-use in Europe(source Joosten & Clarke, 2002)
Aggregated land-cover types and peatland-use in Europe(source Joosten & Clarke, 2002)
Emission factorsfor CO2, CH4 and N2O FEN BOG PEAT CUT
Reco N2O CH4 Cernusca et al, 2002; verändert
EU peatlands: Current carbon stocks and trace gas fluxes Lund, Sweden, 21-22 October 2003