Download
1 / 54
540 likes | 714 Views
An extended K-means++ with mixed attributes for outlier detection. Presented by Miss Sarunya Kanjanawattana. Examination Committee. Dr. Sumanta Guha (Chairperson) Prof. Dr. Phan Minh Dung (Committee) Dr. Matthew N. Dailey (Committee). :: Agenda ::. Background Literature review

E N D
An extended K-means++ with mixed attributes for outlier detection Presented by Miss SarunyaKanjanawattana
Examination Committee Dr. SumantaGuha (Chairperson)Prof. Dr. Phan Minh Dung (Committee)Dr. Matthew N. Dailey (Committee)
:: Agenda :: • Background • Literaturereview • Methodologies
Background • Problem statement • Objective of the study • Scope and Limitation • Contribution
« Background » • Data mining : • huge volume of data and information are collected in databases. • These tremendous data has far exceeded the human ability to analyze extract valuable information for the purpose of decision-making support. “data mining helps to transform the collected data into valuable information”
« Background » • Outlier detection : • Outlier cluster is a popular methodology that uses to detect fraud in data sets. • identify data points as “normal” or “outlier” Outlier data point => fraudulent sample
« Background » • Fraud detection • Health insurance fraud detection is a beneficial and challenging task. • The detection helps to observe the fraud and abuse pattern. Example : Institutional or health professional led health insurance fraud include the falsification of information on forms.
« Background » • The National Health Security office • is an autonomous state agency, officially founded in 2002 , stated by the National Health Security Act • The vital duties of NHSO • are to manage the health security fund and allocate the subsidiary budget to 236 clinics and 963 hospitals to promote and develop a good health care system for all Thai people.
« Problem statement » • Fraud and abuse • led to significant additional expense in the health care system. • A case study : NHSO database • Occurred with the large number of data . • Many transactions emerge constantly daily hour. • These become huge and hard to use human inspections for detecting fraud. • Outlier clustering approach : • Need fast and more accuracy algorithm to monitor outliers
« Objective of the study » • To provide a process of extracting the fraud instances and uncover unusual activities in NHSO. • To develop the K-means++, that is another variation of standard k-means algorithm, with mixed attributes of dataset for detecting outliers. • To answer what is the optimal “”.
« Scope and Limitation » • The data source only involved in 4 provinces in Thailand • Nakhonratchasima, Chaiyaphom, Burirum and Surin. • The transaction comes from a group of High-costs diseases • There is high chance to occur fraudulent behaviors larger than other groups of diseases.
« Contribution » • The proposed study provides the methodology to detect fraud and abuse in NSHO, Thailand. It will present some results of outlier cluster. • This study proposes a novel algorithm based on extended K-means++ to work with mixed attributes and detect outliers.
Literaturereview • Fraud detection • The process of data mining
« Literaturereview » Frauddetection Yi et al. 2006 : • understand and detect suspicious health care frauds from large databases using clustering technique • Use two clusters to compare : SAS EM and CLUTO • As the experimental results indicate that CLUTO is faster than SAS EM while SAS EM provides more useful clusters than CLUTO.
« Literaturereview » Frauddetection Liou, Tang, and Chen 2008 : • Applies data mining techniques to detect fraudulent or abusive reporting by healthcare providers using their invoices for diabetic outpatient services. • Logistic regression, neural network, classification trees • The classification tree model performs the best with an overall correct identification rate of 99%.
« Literaturereview » The process of data mining • Data preprocessing • The data that obtain from the real databases are often incomplete, noisy and inconsistent. • The target of data preprocessing is to clean a rough data set for improve accuracy. • The process of data preprocessing : • data cleaning, data transformation and integration and data reduction.
« Literaturereview » The process of data mining • Data preprocessing Wang and Chiang 2009 : • presents an efficient data preprocessing procedure for the support of vector clustering (SVC) to reduce the size of a training dataset.
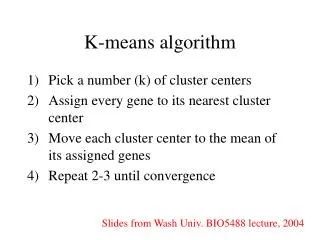
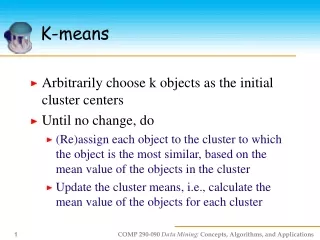
« Literaturereview » The process of data mining • K-means algorithm
« Literaturereview » The process of data mining • K-means algorithm • The benefits of K-means • fast and simplicity. Its algorithm is really easy to understand and implementation. • The shortcoming of K-means • number of clusters dependency • degeneracy
« Literaturereview » The process of data mining • K-means++ algorithm
« Literaturereview » The process of data mining • K-means++ algorithm • Arthur and Vassilvitskii 2007 • Fast and more efficient • K-means : O(i * n * k) • K-means++ : O(log k) • not pretty good to work with a dataset which combines categorical and numerical attribute
D(x) = • the shortest distance from • a data point x to the • closest center we have • already chosen. « Literaturereview » The process of data mining • K-means++ algorithm • Example (k=3)
« Literaturereview » The process of data mining • K-means++ algorithm • Example (k=3)
« Literaturereview » The process of data mining • K-means++ algorithm • Example D2=12+72 D2=82+42 D2=72+32 D2=22+12 (k=3)
« Literaturereview » The process of data mining • K-means++ algorithm • Example D2=12+72 D2=82+42 D2=72+32 D2=22+12 (k=3)
« Literaturereview » The process of data mining • K-means++ algorithm • Example D2=12+72 D2=12+12 D2=22+12 (k=3)
« Literaturereview » The process of data mining • K-means++ algorithm • Example D2=12+72 D2=12+12 D2=22+12 (k=3)
« Literaturereview » The process of data mining • K-means++ algorithm • Example (k=3)
« Literaturereview » The process of data mining • Y-means algorithm
« Literaturereview » The process of data mining • Y-means algorithm • Guan, Ghorbani, and Belacel 2003 • based on the K-means algorithm • It overcomes two shortcomings of K-means: • number of clusters dependency and degeneracy
« Literaturereview » The process of data mining • Koufakou, Ortiz, Georgiopoulos, Anagnostopoulos, and Reynolds 2007 • Introduced a strategy named “Attribute Value Frequency (AVF)”. • That is a fast and scalable outlier detection strategy for categorical data.
Methodologies • Methodology • Data collection • Data evaluation • Tasks and timeline
« Methodologies » • It can divide into 3 phases. • Phases 1: Data preprocessing • Convert categorical data to numeric data • Phases 2: Clustering • Followed by K-means++ algorithm • Phases 3: Outlier detection • Local and global outlier • Determine what cluster is outlier
« Methodologies » • Overview of the extended K-means++ algorithm
« Methodologies » • Phases 1: Data preprocessing
« Methodologies » • Phases 1: Data preprocessing • Normalizes the numeric attributes’ value into the range of 0 and 1
« Methodologies » • Phases 1: Data preprocessing • Normalizes the numeric attributes’ value into the range of 0 and 1
« Methodologies » • Phases 1: Data preprocessing 2) A categorical attribute A with most number of items is selected to be the base attribute. • 2 items: A,B • 3 items: C,D,E
« Methodologies » • Phases 1: Data preprocessing 3) Counting the frequency of co-occurrence, represent by Matrix M • A B C D E • A • B • C • D • E • Matrix M = • 4 0 2 2 0 • 0 311 1 • 0 0 3 0 0 • 0 003 0 • 0 0 0 0 1
« Methodologies » • Phases 1: Data preprocessing 4) Calculate similarity between items represent by equation D • A B C D E • A • B • C • D • E • Matrix M = • 4 0 2 2 0 • 0 311 1 • 0 0 3 0 0 • 0 003 0 • 0 0 0 0 1
« Methodologies » • Phases 1: Data preprocessing 5) Find group variance of numerical value by following equation: • SSw(Y) = 0.04 • SSw(Z) = 1.294 • << Select Y
« Methodologies » • Phases 1: Data preprocessing 6) Every base item can be quantified by assigning mean of the mapping value in the selected numeric attribute.
« Methodologies » • Phases 1: Data preprocessing 7) All other categorical items can be quantified by applying the function: F(A) = 0.4 * 0.2 + 0.4 * 0.8 + 0 * 0.6 = 0.4 F(B) = 0.2 * 0.2 + 0.2 * 0.8 + 0.33 * 0.6 = 0.398 • *All data in data set are numeric now.
« Methodologies » • Phases 2: Clustering • Probability : • D(x) : denote the shortest distance from a data point x to the closest center we have already chosen.
« Methodologies » • Phases 2: Clustering • Define initial values: • = Cluster width • for detect local outlier • Followed by previous study = 2.32. • = Cluster population ratio • for detect global outlier • My assumption : = 0.9 • Detection rate and false negative rate should be get the highest values with optimal “”.
« Methodologies » • Phases 3: Outlier detection
« Methodologies » • Phases 3: Outlier detection • There are 2 stages • Local outlier detection : • = cluster width
« Methodologies » • Phases 3: Outlier detection • There are 2 stages • Global outlier detection • = population ratio
« Data collection » • A real dataset provided by National Health Security office of Thailand was applied to demonstrate the effectiveness of the proposed method. • Primary data will gather information from database especially statement information that contains all financial transactions, Thailand.
« Data collection » • Overview of data set