Download
1 / 54
540 likes | 672 Views
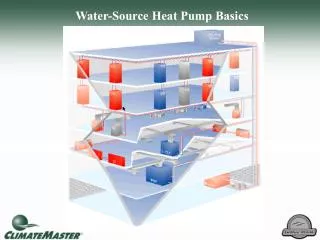
Residential Heat Pump Water Heaters Proven UES Measure Proposal. Regional Technical Forum October 14, 2014. Measure Overview Plan for HPWH Staff Highlighted Areas Provisional Research Results Model Calibration UES Development. Presentation Outline.

E N D
Residential Heat Pump Water HeatersProven UES Measure Proposal Regional Technical Forum October 14, 2014
Measure Overview Plan for HPWH Staff Highlighted Areas Provisional Research Results Model Calibration UES Development Presentation Outline
Review the Measure Properties section on the “Summary” tab of the proposed measure workbook. Measure Overview
Receive RTF direction on a number of important issues (outlined in the next couple of slides) • No decision today • Contract analysts have undergone extensive review of measure analysis and documentation • Contract analysts have high confidence in nearly all aspects of the HPWH model, calibration, and model inputs • Remaining issue is further alignment of modeled and measured energy consumption using generic water draw profiles (slide 31) • Bring final UES measure back for proposed decision next month Plan for HPWH
Model calibration • Does the RTF believe that the HPWH simulation model is sufficiently calibrated? • HVAC interaction factor (interior installs only) • Provisional measure assumed full HVAC interaction (≈100%); provisional research was inconclusive on this • Analysts believe value likely falls between 25 and 100% • Use an assumption in this range OR pursue additional research? • If we use an assumption: • Measure proposer suggests 50% • RTF contract analysts suggest 75% Staff Highlighted Areas RTF Judgment Required Ahead
How to treat impending federal standard (Apr 2015) in measure savings computation • Should all measure savings be subject to the standard now, or should the RTF develop separate savings which are valid until the standard goes into effect? • Can we have an “any size” tank measure that assumes the current distribution of tanks going through programs? What about after the standard goes into effect? • For self-installs, does the RTF still want to value people’s time at $0? Staff Highlighted Areas (continued) RTF Judgment Required Ahead
Base case water heater • Electric resistance tank (COP ≈ 0.90) • Efficient case heat pump water heaters (HPWHs): • Tier 1, 50-75 gallons (COP ≈ 1.69) • Tier 1, 75+ gallons (COP ≈ 2.29) • Tier 2, any size tank (COP ≈ 2.30) • Install locations • Unheated buffer locations • Includes garages and basements together • Heated installations • One measure for each of gas furnace, electric furnace, zonal resistance, and heat pump heating • Tier 1 water heaters have no exhaust ducting • Tier 2 water heaters all have exhaust ducting Current Provisional Measures
Current Provisional Measures (continued) • The measures cross the entire PNW and are not separated by climate zone
http://rtf.nwcouncil.org/meetings/2012/02/HPWH_Ducted_Interior_Installations_Provisional_Proposal_021412_v5.pptxhttp://rtf.nwcouncil.org/meetings/2012/02/HPWH_Ducted_Interior_Installations_Provisional_Proposal_021412_v5.pptx Research Plan & Outcomes
BPA (conducted by EPRI): ~50 units from Rheem, GE, AO Smith NEEA (conducted by CleaResult): 30 AirGenerate Units NEEA (conducted by Ecotope): 50 GE, AO Smith, AirGenerate Units Field Study Research
Billing analysis not able to evaluate changes in water heating energy use • Validated inputs feed a calibrated simulation • Reliable estimates of energy use & savings • Topics to discuss • Water Heater Simulation Calibration • Simulation Inputs and Measure Parameters • Measure Definitions • HVAC Interaction Factors Developing the UES
HPWH Simulation Calibration Condenser coils wrapped outside of tank Resistance Element Condenser coils immersed in tank Resistance Element
Information needed for a simulation • Input Power – f(Tambient air, Ttank water) • COP – f(Tambient air, Ttank water) • Control logic • Tank storage volume • Tank heat loss rate (UA) • Where does the heat get added to the tank? • Unique simulations for GE GeoSpring, AO Smith Voltex, and AirGenerate ATI • Simulation runs at 1-minute time steps • Fully integrated with SEEM Water Heater Simulation Background
Use field data as our “ground truth” • Feed field data for water draw, inlet water temperature, and ambient air temperature to simulation • Simulation outputs runtime for compressor and resistance elements • Goal is to match simulation output to field data • Optimize Simulation: • Use Markov Chain Monte Carlo (MCMC) to incrementally vary simulation parameters like COP curves and temperature deadbands. • Run lots of simulations and look for best match Simulation Calibration
Voltex Simulation Example 1 - Good Match Bright blue area shows actual power use; orange line is model- predicted power use. Taller spikes show resistance heat turning on; smaller area represents the heat pump running. The goal is to have the orange line predict (i.e. outline) the blue area; it does that near perfectly for this site.
Voltex Simulation Example 2 – Bad Match For this site… not so much. First, the model predicted resistance heat turning on, which did not happen in reality. Second, the model predicted compressor runtime events, but did not match the timing or duration of the actual events.
Calibrated COP Curves AO Smith Voltex AirGenerate ATI GE Geospring
Measured vs. Calibrated Modeled Energy Consumption (kWh) – Sites in Calibration Set Calibration results for the 50 sites used as the basis of the calibration. Uses actual site inputs (water draw, inlet water temp).
Calibration Results Frac Matching is defined as the fraction of simulated ontime that coincided with observed ontime.
Calibration Set, n = 57 • Test Set, n = 29 • Total, n = 86 • Sites excluded due to • measurement failures (e.g. no flow or ambient temperature) • suspected HPWH failures • data handling burden Measured vs. Calibrated Modeled Energy Consumption (kWh) – All Sites Uses actual site inputs (water draw, inlet water temp). • Does the RTF believe that the HPWH simulation model is sufficiently calibrated?
As measured and documented in the HPWH Model Validation Study1 (the study designed to bring this measure from provisional to proven) • Water Draw Profiles • Inlet Water Temperature • Tank Set Point • Ambient Space Temperatures • These were almost completely unknown for the provisional measure • Validated inputs feed the calibrated simulation model Reliable estimates of energy use & savings Calculation Inputs and Simulation Parameters 1 NEEA. Heat Pump Water Heater Model Validation Study (Draft). Prepared by Ecotope. July 2014.
Goal: create typical (generic) draw profiles suitable for use in a simulation • Method: • Collect descriptive characteristics of observed draws and create our own, typical patterns • Characteristics • Total draw volume • Number of small, medium, & large draws (1-2, 3-9, 10+ gals) • Average size of small, medium, & large draws • Time of draws • Different pattern for different numbers of occupants • 1, 2, 3, 4, & 5+ occupants • Total flow in daily pattern must equal observed average daily flow Draw Profile Derivation
Characterize by “Windows” of draw activity within a day • Observed draw events typically clustered within a window of activity • Collect the average characteristics for each window • 3 & 4 Occupant Daily Example: Draw Derivation (continued)
First Window, centered at 7:30am, 1 hr wide • Draws: 2 small, 1 medium, 1 large Daily Profile Example
Repeats every week for entire year Daily volume scaled every day of the year by change in incoming mains temperature (less in summer, more in winter) Weekly Profile Example
Measured vs. Modeled Energy – All Sites using Generic Model Inputs Average measured kWh: 1,664 Average modeled kWh: 1,473 Difference: 11.5% Looks like there may be a bias, particularly at high consumption sites. This piece of work UNDER CONSTRUCTION.
Current practice • Any HPWH tank sold has savings regardless of size • Current assumptions: • Baseline is a mix of tank sizes according to the current market saturation1 • 88% ≤ 55 gals and 12% > 55 gals • After federal standard goes into effect, 12% of market will be forced to buy a HPWH because of federal standard (except for some fraction of those working around the standard) 12% of Tier 1 sales have zero kWh savings (& cost) 12% of Tier 2 sales have reduced kWh savings (& cost) • Caveat: manufacturers expect some fraction of the large tank population to “work-around” the federal standard • This analysis assumed 25% work-around rate Measure Definitions 1 RBSA Single Family Characterstics and Energy Use Report. 2012. Table 109.
Tier 1 Equipment Mix • GE GeoSpring is a lower-end Tier 1 performer • AO Smith Voltex and RheemEcoSense are high-end Tier 1 performers • Generic Tier 1 Unit is 87% low performance unit, 13% high performance unit based on current program data • Tier 2 Equipment “Mix” • Generic Tier 2 Unit is 100% Air Generate ATI since this is the only qualifying unit currently available • Market is evolving rapidly • A short sunset period (≈ 1 year) is recommended to check status of the market and make adjustments to weightings as needed Measure Definitions
Federal standard coming in April 2015 raises questions concerning the calculation of savings: • Should all measure savings assume the new standard now, or should the RTF develop separate savings which are valid until the standard goes into effect? • If new standard is assumed now, large tanks get no savings (Tier 1) or reduced savings (Tier 2) • Or, RTF could develop two measure sets: one which gives full savings to large tanks until Apr 2015 at which time they expire, and one which takes effect starting in Apr 2015 and gives reduced savings to large tanks Measure Definition: Issues RTF Judgment Required Ahead
Can we have an “any size” tank measure that assumes the current distribution of tank sizes going through programs? What about after the standard goes into effect? • Currently proposed measure allows any size tank and weights savings by tank size according to current program throughput • Options: • Accept proposal and use shorter sunset date to check in on tank sizes going through programs in the future • Create separate small tank / large tank measures to reflect the different standards treatment of these two categories • Staff thinks first option is appropriate for now, but creating two measures may be necessary after the sunset date Measure Definition: Issues (cont’d) RTF Judgment Required Ahead
Preliminary Simulation Results: Hot Water Savings Only (i.e. no HVAC interaction added yet)
Cost Data RTF Judgment Required Ahead For self-installs, do we still want to value people’s time at $0?
Applies only to interior ducted or non-ducted installations (i.e. garages and basements are excluded) Heat pump water heaters extract heat from the space where they are installed. Some of that heat energy is replaced by the heating system . We have observed that not every unit of energy removed from the air by the HPWH is replaced by the heating system Heating System Interaction
Conditioned Space Installation Heat Flows Cool HPWH Exhaust Air Warm House Air Tank Heat Losses HVAC System Interaction = m*cp*ΔT + QUA Typical air Δ T at 68F entering air: ~15F
Ducted, Conditioned Space Heat Flows Cool HPWH Exhaust Air Warm House Air Added Infiltration Load Tank Heat Losses HVAC System Interaction = m*cp*ΔT + QUA Δ T now depends on outside air T m now depends on added infiltration load
Field study of interaction factors was inconclusive • Expert judgment needed • Houses are not single zones (no surprise) • The HPWH install zone can thermally “decouple” to varying degrees from thermostated part of house • Recommend using the same interaction factor for both unducted and ducted installations • (when you don’t know something, make the simplest estimates) • What we know from PNNL Lab Homes Study1 • Interaction factor for interior installations ≈ 49% • Interaction factor for ducted installations ≈ 44% • Study looked at one installation of a HPWH in a closet next to an exterior wall Heating System Interaction Factors RTF Judgment Required Ahead 1 PNNL. Impact of Ducting on Heat Pump Water Heater Space Conditioning Energy Use and Comfort. July 2014.
What to do on interaction factor? • Consider more research to further explore this value (PNNL lab homes?) • Assume a value; if a value is assumed: • Proposal is to use 50% per the PNNL study • Contract analysts propose 75%, as the PNNL study looked at a particular installation (next to an exterior wall) which could yield a lower than average value Heating System Interaction Factors RTF Judgment Required Ahead
Sensitivity of Total Savings to Heating Interaction Factor (%) Interaction Factor
Sensitivity of Total Savings to Heating Interaction Factor (%) Interaction Factor
Phase I SEEM Calibration implemented • Of minor importance (only impacts space heating interaction) • For simplicity, used a full insulation retrofit package to set the building U0 • Phase II SEEM Calibration implemented • Non-utility fuel accounted for • Water heater scavenges some heat from the wood stove so we don’t see an electric grid penalty but we do need to buy more wood • Cooling interaction ignored as of this time • Impact is less than loose change in the sofa Other Notes
Preliminary Results: B/C Ratios(Assuming HVAC Interaction Factor of 50%)
HZ1 – city surface HZ2 – city ground HZ3 – well The water-flow, weighted saturation of water distribution types is unknown. Assignments made above are meant to be representative of the climate zones. Inlet Water Profiles Used