Download
1 / 51
510 likes | 684 Views
Essentials of Excellence in Quality Management: Using the Baldrige Criteria for Performance Excellence as a Model for Management & Improvement. Workshop Objectives. Show how the Baldrige criteria can be used as a management framework, and the value of doing so

E N D
Essentials of Excellence in Quality Management: Using the Baldrige Criteria for Performance Excellence as a Model for Management & Improvement
Workshop Objectives Show how the Baldrige criteria can be used as a management framework, and the value of doing so Discuss relationship of Baldrige to quality improvement approaches Show various approaches in using criteria
Today’s Agenda • The case for the Baldrige model • Baldrige Business Model & Criteria Structure • Graded approaches to use: • Organizational Profile • Self-Assessment Matrix • Baldrige Express • Quality Award Application • Wrap up - evaluation
The Case for MBNQA Model • Provides QM perspective for entire organization, not just specific elements • Integrating framework for illustrating and understanding organizational relationships • Provides QM focus on critical aspects of Leadership system, including governance
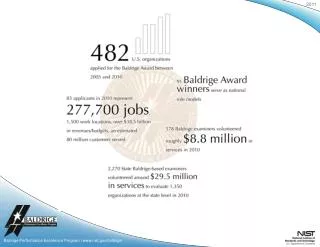
Baldrige Performance Excellence Criteria Purpose: to recognize U.S. organizations for their achievements in quality and performance and to raise awareness about the importance of quality and performance excellence as a competitive edge Attributes: • Framework and criteria to assess the enterprise’s performance and quality improvement efforts • Criteria evaluated and improved each year - annual improvement cycle (16 cycles 1988-2004) Keeping Score: • Score (0-1000) provided along with strengths and opportunities for improvement
Some Evidence… Source: Kevin B. Hendricks and Vinod R. Singhal, “Don’t Count TQM Out,” Quality Progress, April 1999
…more of the Evidence… Source: Q100 Index, Robinson Capital Management
Employee Selection Illustration of Process-based Enterprise Management Reporting Training & Development • Customers • Asset Owners • Public Planning Core Business Processes Objectives & Goals Budgeting Recognition & Rewards Communication Performance Management
Alignment of Soft Systems ? Reward ? Recognition • Goals • Individual • Team • Organizational ? Communication Promotion ?
Customer To achieve our vision, how should we appear to our customers? Strategy & Vision Financial To succeed financially, how should we appear to our stakeholders? Internal Process To satisfy our customers, what business processes must we excel at? Innovation and Learning To achieve our vision, how will we sustain our ability to change & improve? BSC Perspectives
Increased Customer Revenue Financial Loyalty Customer On Time Quality Delivery Internal Process Quality Cycle Time Learning/Growth Employee Skills “The chain of cause and effect should pervade all four perspectives of the BSC.” Cause & Effect Lagging Results LeadingIndicators
Profile Organizational Description Organizational Relationships Organizational Challenges Process categories: Categories 1 through 6 Leadership Strategic Planning Customer and Market Focus Measurement, Analysis, and Knowledge Management Human Resource Focus Process Management Results: Category 7 Business Results Baldrige Categories:Profile, Process and Results
Profile • Identifies Key Factors: attributes of an organization and its environment that help evaluators assess the organization • Main products or services; how they’re delivered to customers • Culture (mission, vision, values) • Employee profile (how many, what kinds, educational levels, demographics) • Technologies, equipment, facilities • Regulatory environment • Structure and governance • Key customers and their requirements • Suppliers and partners and their role • Competitive environment • Strategic challenges (business, operational, human resource) • Performance improvement system
Criteria Structure • Seven Categories focusing on the major components of the framework • 19 Items focusing on a major requirement of their respective Categories • 32 Areas to Address focusing on specific requirements of their respective Items • Item Notes • Clarifying terms or requirements • Giving instructions on responding to Item requirements • Indicating key linkages to other Items
Baldrige Criteria for Performance Excellence Leadership StaffFocus People Focus Customer & Market Focus Organizational Results Work Core Strategic Planning ProcessManagement Driver Triad Process Focus which bring about results here guide changes here Changeshere Measurement, Analysis, and Knowledge Management
Measurement, Analysis, and Knowledge Management Core Values: the Foundation of the Criteria Leadership StaffFocus Customer & Market Focus Organizational Results Strategic Planning ProcessManagement Visionary Leadership Customer-Driven Excellence Organizational & Personal Learning Valuing EE’s & Partners Social Responsibility Focus on the Future Managing for Innovation Management by Fact Agility Focus on Results and Creating Value Systems Perspective
Bringing It All Together Strategic Planning Human Resource Focus • Strategic Planning • Operational Plans/Goals • Financial Goals • Technology Needs • Initiatives/Supporting Actions • Differentiation/Competitive • Advantages • Deployment of Plan • Work Structures • Employee Performance Management • Hiring and Succession Planning • Education, Training, Development • Employee Well-being • EE Satisfaction 1. Leadership Business Results • Customer-Focused • Product and Service • Financial and Market • Human Resource • Organizational • Effectiveness • Governance and Social • Responsibility • Leadership M/V/V and Operating Principles • Governance • Performance Reviews • Social Responsibility Customer & Market Focus Process Management • Market Knowledge • Customer Requirements & • Segmentation • Relationship Management • Customer Satisfaction • Value Creation Processes • Support Processes Measurement, Analysis, and Knowledge Management • Performance Measurement • Performance Analysis • Data and Information Availability • Organizational Knowledge
Leading / Lagging • Number & phase of active projects being worked • Cycle time of projects • Dollar value & phase of projects being worked • Leading / Lagging • Quantity / quality of projects in pipeline • Age of projects by phase (DMAIC) in active pipeline • Leading • Quality & quantity of trained resources • Systems / infrastructure to ID, & act upon opportunities (VOC, E2E process management, OP Reviews) University of MN Six Sigma Program Scorecard: Leading & Lagging Indicators Financial transformation Operational & organizational transformation • The big “Y” • Projects closed with customer & / or dollar impact You must manage the process since you cannot manage the outcome
Mission Mission Vision Vision MBNQA Baldrige Assessment A Tool to Focus, Align, and Accelerate Performance Improvements Efforts Limited Business Vision or Alignment:individuals work toward different goals; energy is diffused Business Vision with Limited Departmental & Individual Alignment:energy is still diffused Business Vision with Departmental & Individual Alignment:goals, objectives, and strategies are focused and mutually supported
Baldrige Category 2.2 – Strategy Deployment Linkages Illustration of System Interrelationships P.1 7.6 P.2 7.5 1.1 7.4 1.2 7.3 2.1 7.2 2.2 7.1 3.1 6.2 3.2 6.1 4.1 5.3 5.2 4.2 5.1 Adapted from Insights to Performance Excellence 2004: An Inside Look at the 2004 Baldrige Award Criteria ASQ Press
Use of Statistical Thinking Depends on levels of activity and job responsibility. Where we're headed Strategic Executives Managerial processes to guide us Managerial Managers Where the work gets done Operational Workers
Tournament Scheduling Hastings Basketball Boosters Program Key Core and Support Processes Tryouts & Team Selection Spiral Tournament Planning Coaching Selection, & Development • Community • Outcomes • Youth Players • Parent Support • HS Program • Success Core Processes: Practice and Tournament Play Program Objectives & Goals Communication & Publicity Volunteer Coordination Finance & Budgeting Traveling and In-House Program Management and Improvement
Approaches to use of Baldrige(at any level of organization) • Profile only • Business Process Design • Self-Assessment (scoring optional) • Baldrige Express • Award Application For more information on approaches to using criteria, see description of “Business Excellence Assessments” at www.dhutton.com/baldrige/assessme.html )
Conduct Site Visit Prepare Narrative Review Independently Reach Consensus Plan & Take Action Conduct Site Visit Prepare Inputs Review Independently Reach Consensus Plan & Take Action “Baldrige Express” vs. Traditional • The survey-based Baldrige Express approach: • The “traditional” narrative-based approach: • Organization Profile • Survey • Organization Performance Results
So What?What Do I Do Now? Baldrige Balanced Score- card Six Sigma. ISO 9000 Lean Mfg.
“Breakthrough Thinking”: Gerald Nadler & Shozo Hibino - - the Purpose Hierarchy I II III IV V
Scoring Sample Assessment Scoring Summary Score # of Points 1 Leadership 1.1 1.2 Organizational Leadership (70 points) Social Responsibility (50 points) 30% 40% 21 20 2 Strategic Planning 2.1 2.2 Strategy Development (40 points) Strategy Deployment (45 points) 20% 20% 8 9 3 Customer and Market Focus 3.1 3.2 Customer and Market Knowledge (40 points) Customer Relationships and Satisfaction (45 points) 12 13 30% 30% 4 Information and Analysis 4.1 4.2 Measurement/Analysis of Organizational Performance (45 pts) Information and Knowledge Management (45 pts) 30% 50% 14 22 5 Human Resource Focus 5.1 5.2 5.3 Work Systems (35 pts) Employee Learning and Motivation (25 pts) Employee Well-Being and Satisfaction (25 pts) 14 13 8 40% 50% 30% 6 Process Management 6.1 6.2 Value Creation Processes (50 pts) Support Processes (35 pts) 30% 20% 15 7 7 Results Customer Focused Results (75 pts) Product and Service Results (75 pts) Financial and Market Results (75 pts) Human Resource Results (75 pts) Organizational Effectiveness Results (75 pts) Governance and Social Responsibility (75 pts) 20% 20% 30% 30% 30% 40% 15 15 23 23 23 30 7.1 7.2 7.3 7.4 7.5 7.6
Baldrige Item Scores: example 503 points (MB) % Process (550 points) Results (450 points) 50% Process Mgmt Customer/Mkt Measure, KM Leadership HR Focus Planning Results
Process: Effective, systematic approaches, responsive to the overall requirements Approaches well-deployed, although deployment may vary in some areas Fact-based systematic evaluation and improvement process in place and some organizational learning apparent Approaches are aligned with organizational needs Results Improvement trends and/or good performance levels for most areas of requirements No pattern of adverse trends or poor performance levels Some trends/levels show good relative performance (comparisons) Business results address most key customer, market, and process requirements What can you say about a MB 500 point organization?
What can you say about a 500 point organization? • The organization demonstrates effective, systematic approaches to the overall requirements of the Items, but deployment may vary in some areas or work units. Fact-based evaluation and improvement address the efficiency and effectiveness of key processes. Results address key customer/stakeholder, market, and process requirements, and they demonstrate some areas of strength and/or good performance.
What can you say about an organization that: • Is ISO 9000:2000 certified? • Is Level 4 on Software CMM? • Has saved $2.5M from process improvements this past fiscal year? • Has 1 Quality Tools expert for every 250 employees in the organization? • Has reduced cycle times by 20% each of the past 2 years in its product development cycle? • Has aligned its recognition system with its core values?
The Quality Journey Desired future state Some means to measure overall progress Now Start Time
The Quality Journey Desired future state Business Baldrige Journey 700 Some means to measure overall progress 600 500 400 MB Points 300 200 Where do we want to be & How do we measure progress? Now 100 0 2000 2001 2002 2003 2004 2005 2006 Start Time
What are the roadblocks? 70% of the initiatives fail: Biggest obstacles that XXX faces are: Lack of sustained management commitment and leadership Unrealistic scope and expectations 3. Resistance to Change
Transition to Baldrige requires Systems Thinking Critical Mix of Skills and Behaviors Top Level Management (Leadership) Administrative and Conceptual Skills (Systems Thinking) Middle Management(Managers) Interpersonal Skills First-level Management (Supervisors) Technical Skills Adapted from One More Time: Preventing Managerial Failure Among Engineers and Scientists Van Nostrand Reinhold
Value of being a Baldrige Evaluator • Strengthen Understanding of the Criteria for Performance Excellence…“best practices” that have been validated to drive organizational excellence • Improve ability to evaluate an organization’s management system • Improve transferable skills: communication (verbal and written), teamwork, investigative and analytic skills, and leadership • Network with professionals
The Basis of Evaluation for Process Categories (1 through 6) ADLI Approach Deployment Learning Integration
Evaluating a Process Item:Approach Definition: Methods or processes used to meet the requirements of the criteria • Systematic and fact-based • Appropriate for the Item requirements • Effective
Evaluating a Process Item:Deployment Definition: The extent to which an approach is applied in addressing the requirements of an Item • Used by or for all work units, locations, shifts, stakeholders, product lines, or employees, as appropriate • Consistent • Tip: Deployment opportunities are usually communicated to evaluators through the Organizational Profile
Evaluating a Process Item:Learning Definition: New knowledge or skills acquired through evaluation, study, experience, and innovation • Cycles of evaluation and improvement for individual approaches • Sometimes “breakthrough” improvement through innovation • Sharing of refinements and lessons learned throughout the organization
Evaluating a Process Item:Integration Definition: The harmonization of plans, processes, information, resource decisions, actions, results, and analysis to support key organization-wide goals • Alignment of approaches with organizational needs • Measures, information, and improvement systems are complementary across processes and work units
The Basis of Evaluation for Results (Category 7) • Level of performance • Rate and breadth (trends) • Performance relative to comparisons and benchmarks • Linkage to important requirements
Evaluating a Results Item:Level of Performance Definition: Numerical information that places or positions an organization’s results and performance on a meaningful measurement scale. • Permit evaluation relative to past performance, projections, goals, and appropriate comparisons
Evaluating a Results Item:Rate and Breadth (Trends) Definition: Numerical information that shows the direction and rate of change for an organization’s performance, and how widely deployed or shared performance improvements are • Trends provide a time sequence of organizational performance • Minimum of three data points needed to demonstrate a trend; time periods can vary • May be positive or negative • Positive trends may be up or down, depending on what is being measured • Data may show no trend
Evaluating a Results Item:Comparisons Definition: Performance relative to appropriate comparisons and/or benchmarks • Benchmarks are processes and results that represent best practices and performance for similar activities, inside or outside an organization’s industry • Other comparisons might include industry data collected by a third party (e.g., industry averages), data on competitors’ performance, and comparisons with similar organizations in the same geographic area • Sometimes comparisons with Baldrige winners or other world-class organizations may be used • Performance may be worse than, the same as, or better than comparisons
Evaluating a Results Item:Linkage Definition: Linkage of results measures (often through segmentation) to important customer, product and service, market, process, and action plan performance requirements • These requirements are identified in the Organizational Profile and in process Items (Categories 1 through 6)
Evaluating a Results Item: EXPECTED RESULTS • Data on topics listed in criteria for each item • Data related to strategic challenges reported in organizational profile • Appropriate segmentation of data • Customer/market segmentation • Workforce: employee types, locations, shifts • Product lines
Sources of Expectations • Organizational profile • Strategic plan & action plans • Approaches described in process items