Download
1 / 25
260 likes | 365 Views
Chapter I Measures of Central Tendency & Variability. Curriculum Objective: The students will determine the measures of central tendency and variability Apply these tendencies to solving problems Analyze these measure in the case. What is Statistics?. Descriptive Statistics

E N D
Chapter IMeasures of Central Tendency& Variability Curriculum Objective: The students will determine the measures of central tendency and variability Apply these tendencies to solving problems Analyze these measure in the case
Descriptive Statistics Describe the characteristic of the data such as ; mean, median, std dev, variansi etc • Inferential Statistics Make an inferences about the population, characteristics from information contained in a sample drawn from this population Such as : prediction, estimation, take the decision
1. Population Is the set of all measurements of interest the investigator parameter • Sample Is a subset of measurements selected from the population of interest statistic
Data Scale Qualitative Data a. Nominal Example: gender, date birth same level b. Ordinal Example : taste, grade score(difference level) Quantitative Data a. Interval Data have a range Example : Hot enough: 50 – 80 derajat C, Hot 80 – 110 C, Very Hot: 110 – 140 C b. Ratio Data Can be applied with mathematic operations Example : height, weight
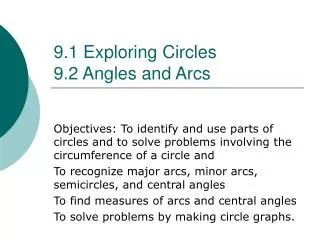
What is measure of tendency?
An Naas AIM Central tendency QOLB Dispersion tendency MISSING Dispersion tendency MISSING Dispersion tendency MISSING
Statistic Ilustration • Imagine you were a statistician, confronted with a set of numbers like 1,2,7,9,11 • Consider a notion of “location” or “central tendency – the “best measure” is a single number that, in some sense, is “as close as possible to all the numbers.” • What is the “best measure of central tendency”?
Measure of central tendency • Central tendency • A statistical measure that identifies a single score as representative for an entire distribution. • The goal of central tendency is to find the single score that is most typical or most representative of the entire group.
Measure of central tendency • Mean Population mean vs. sample mean • Example N=4: 3,7,4,6
Estimating the Mean from a Grouped Frequency Distribution Example
2. Median • The score that divides a distribution exactly in half. • Exactly 50 percent of the individuals in a distribution have scores at or below the median. • The median is often used as a measure of central tendency when the number of scores is relatively small, when the data have been obtained by rank-order measurement, or when a mean score is not appropriate. • Therefore, it is not sensitive to outliers
Calculating the Median • Order the numbers from highest to lowest • If the number of numbers is odd, choose the middle value • If the number of numbers is even, choose the average of the two middle values. • odd: 3, 5, 8, 10, 11 median=8 • even: 3, 3, 4, 5, 7, 8 median=(4+5)/2=4.5 • Note : • The mean is “sensitive to outliers,” while the median is not.
Sensitivity to Outliers Ex: Incomes in Weissberg, Nova Scotia (population =5) In the above example, the mean is $1,111,000, the median is 24,100. Which measure is better?
Mean : Sensitivity to Outliers Incomes in Weissberg, Nova Scotia (population =5) In the above example, the mean is $1,111,000, the median is 24,100. Which measure is better?
FREQUENCIES DISTRIBUTION : • It used to organized sistematically data in many group without reduce the data information • If there are a lot of data then its will be divide on many of class but if the there are little data then we need’nt to devide it
Steps to make freq. distr • Decide the amount of the class (∑K) that will taken from N data • Decide the range • Decide Class Interval ∑K = 1 + 3,3 Log N Range (R) = The biggest obs-the smallest obs Ci = R / ∑K
∑K = 1 + 3,3 Log 80 =7.28~7 R=99-35=64 Ci=64/7=9.14 ~10
Finding Mean for grouped data with xk=midle value every classnilai tengah tiap kelas fk =class frequencies
Finding Med For grouped data with Tb : lb med interval class, i: class interval N : amount of the observation fseb : cum freq before med class
MODUS Is value or phenomenon that the most often appear, if the data is grouped than we have :