Download
1 / 91
910 likes | 919 Views
A brief tutorial on approaches to analyzing gene expression array data. Elisabetta Manduchi Lab Meeting June 27, 2002. Acknowledgment: Slides marked with S have been kindly provided by Terry Speed. Some of these

E N D
A brief tutorial on approaches to analyzing gene expression array data Elisabetta Manduchi Lab Meeting June 27, 2002 Acknowledgment: Slides marked with Shave been kindly provided by Terry Speed. Some of these slides have been slightly modified.
Notes • In this tutorial we will focus on the array technology as it pertains to the study of gene expression. This enables the monitoring of RNA abundance levels in a given sample for thousands of genes in parallel. • All the experiments discussed are aimed at capturing information about RNA abundance. • There is no strict linear relationship between genes and the “proteome” of a cell, as there might be modifications of the proteins that are not apparent from the DNA sequence (post-translational modifications). • There are many more applications of array technology (genotyping, determining identity-by-descent, identifying protein binding sites, etc.).
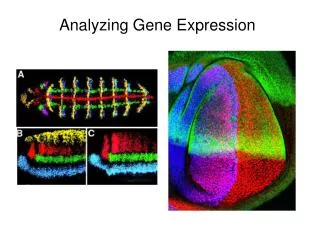
Outline • Different kinds of gene expression array experiments. • Questions these data can help to address. • Image analysis and data preprocessing issues. • Overview of some analysis methods for differential expression, class discovery, and class prediction.
Outline • Different kinds of gene expression array experiments. • Questions these data can help to address. • Image analysis and data preprocessing issues. • Overview of some analysis methods for differential expression, class discovery, and class prediction.
Different array platforms nylon filter array short oligonucleotide array two-channel microarray
Generalities Exploits complementary base-pairing. The steps are: • Prepare the array. • Prepare the RNA source. • Hybridize probe to target. • Scan image. • Quantify image.
cDNA • Most mRNA molecules contain 3’ polyA tails. • Use poly-T oligomers to prime the synthesis of cDNA strands by reverse transcriptase. • RNA-DNA duplexes can be converted to double stranded DNA molecules (ribonuclease H, DNA polymerase I, DNA ligase) and can be inserted into cloning vectors. • Expressed-sequence tags (ESTs) can then be derived.
Filter Arrays See paper by Zaho et al. (1995). • cDNA clones are spotted on the array (possibly multiple spots for the same clone). • RNA source is processed: • (polyA) RNA is purified from tissues • cDNA is generated with reverse transcription and radioactively labeled. • Probe is hybridized to target.
Filter Arrays: limitations • Cross-hybridization (sequences with high sequence identity, repeats, etc.). • Hard to distinguish the transcripts generated by alternative splicing. • Distortion. • Several sources of bias and noise: • variation in spot size, shape, and concentration • variation in PCR reaction efficiency • variation in labeled nucleotide incorporation.
Two-channel Microarrays See paper by Schena et al. (1995). • Preparing the array: • (amplified) cDNA clones or long oligos (e.g. 70mers) are deposited into individual wells of a plate (possibly multiple depositions for the same clone/oligo) • samples from the plate are printed onto a glass microscope slide • the array is processed by chemical and heat treatment to attach the DNA sequences to the glass surface and denature them.
S Building the chip Ngai Lab arrayer , UC Berkeley Print-tip head
S Pins collect cDNA from wells well plate Contains cDNA probes Print-tip group 1 cDNA clones Print-tip group 7 Glass Slide Array of bound cDNA probes In this case: 4x4 blocks = 16 print-tip groups
Two-channel Microarrays (cont.) • Preparing the RNA sources: two samples are analyzed simultaneously. For each of them: • polyA mRNA is prepared and reverse transcribed with incorporation of a fluorescent label (usually Cy3 [green] for one sample and Cy5 [red] for the other) • A variety of labeling methods are currently available (e.g. direct labeling, indirect labeling, dendrimers) • the RNA is then degraded.
Two-channel Microarrays (cont.) • Hybridization: the labeled cDNAs are competitively hybridized to the array. • Scanning: utilizes a laser fluorescent scanning procedure (sequential excitation of the fluorophores). Emitted light is split according to wavelength and detected. • Quantifying: signals are then quantified separately, and the ratio of the two channels for each spot is also reported.
A two-channel microarray experiment Figure from: David J. Duggan et al. (1999)Expression Profiling using cDNA microarrays. Nature Genetics21: 10-14
Two-channel Microarrays: limitations Some of the limitations that are also common to filter arrays: • A large number of cDNA or PCR products must be prepared, purified, quantified, catalogued, and spotted onto a solid support. • If the cDNAs are derived from a cDNA library, low abundance cDNAs are unlikely to be spotted and the library must be normalized to reduce the redundant spotting of cDNAs from highly expressed genes . • Cross-hybridization. • Alternative splicing hard to detect.
Short Oligonucleotide Arrays See paper by Lockhart et al. (1996). • Preparing the array • covalently attached oligonucleotides chemically synthesized directly on a solid substrate • for each mRNA being monitored, a collection (probe set) of probe pairs (16 to 20) is synthesized on the array • each probe pair consists of two probe cells: one containing (millions of) copies of a given 25-mer that is a perfect match (PM) to a subsequence of the mRNA in question and the other containing copies of a companion (MM) 25-mer that has a single base difference in a central position.
Short Oligonucleotide Arrays (cont.) • Preparing the RNA source • polyA RNA is converted to cDNA • cDNA is transcribed in vitro in the presence of fluorescently labeled (biotin or fluorescein) ribonucleotides, giving rise to labeled RNA • RNA is then fragmented with heat (fragment average size of 50 to 100 bp). • Hybridization occurs in a flow-cell. A brief washing step follows to remove un-hybridized RNA.
MAS 4.0 • An intensity for each cell is computed (3rd quartile of pixels distribution in that cell, after excluding bordering pixels) • Background values are computed (after dividing the array into sectors) and subtracted from cell intensities • The number of probe pairs where PM signal >> MM signal and PM signal << MM signal is computed as well as the average of the log of the PM/MM ratios for each probe set • A presence/absence call is made on each probe set • ave(PM-MM) is calculated for each probe set and assigned as the intensity of the corresponding mRNA
Expression Indices:MAS 4.0 • Average Difference (AD) method with A the subset of probes for which dj=PMj-MMj are within 3 SDs away from the average of d(2), …, d(j-1)where d(j)is the j-th smallest difference. This is called Super-Olympic-Scoring (SOS) method.
MAS 5.0 • Motivation was to improve certain areas: • AD method is minimally robust against minority probes • Negative values are impossible for concentration of intensity and indicate that bias is larger than true effect • Incompatible with standard log-transformation • New algorithm (using a one-sided Wilcoxon’s signed rank test) for P/A calls is incorporated • Background: for each cell, its distance from each sector center is computed and used to weight that sector’s background contribution to the cell’s background
Expression indices: • Adjust PM for stray signal, where stray estimate=best of two estimates • The probe set intensity (Signal) is given by taking the Tukey biweight of log2(PM)-log2(stray) • The Tukey biweight gives a smooth downweight of ouliers; it’s a weighed (by MAD) mean • Stray signal are typically estimated using the MM values, but anomalous MM values are handled with imputation • It appears as: • stray=MM, if physically possible • log2(stray)=log2(PM)-log2(stray proportion), otherwise where stray proportion=max(SB, positive) (should this be log2(stray proportion)?) SB=Tukey biweight(log(PM)-log(MM))
Short Oligonucleotide Arrays:other low level analysis work • See http://www.stat.Berkeley.EDU/users/terry/zarray/Affy/GL_Workshop/genelogic2001.html for a recent workshop. • This includes work by Li and Wong (2000, 2001) for work on low level analysis of short oligo arrays.
Outline • Different kinds of gene expression array experiments. • Questions these data can help to address. • Image analysis and data preprocessing issues. • Overview of some analysis methods for differential expression, class discovery, and class prediction.
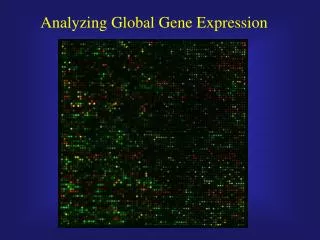
identification of genes which are expressed in a given biological sample identification of genes which are differentially expressed between two samples background calculations quality control/data flagging replication normalization (within and between slides) transformations Questions/Issues
Expression profiles Given a collection consisting of n gene expression experiments, each involving k genes, get an kn data matrix. For each experiment (sample) we have an expression profile (or molecular fingerprint) of length k over the genes. For each gene we have an expression profile (of length n) over the experiments.
Questions: class discovery • Group (i) the samples or (ii) the genes by similarity of their profiles (unsupervised clustering). • Motivation • (i) determine a molecular classification of samples (e.g. subtypes of tumors which are morphologically indistinguishable) • (ii) determine groups of genes which are co-expressed and possibly co-regulated.
Questions: class prediction • Given known classes of samples, build a prediction model, based on their molecular fingerprints, to be used to classify novel samples. • Given expression profiles for a set of genes with known function, form groups and assign other genes to these groups (supervised clustering).
Questions: gene networksMore issues • Reverse engineering: infer gene networks from gene expression profiles (e.g. using time series). • This is a hard problem to tackle and requires lots of data. Work on this issue is at a more preliminary stage. For an overview see D’haeseleer et al. (2000). • More work can be found in the literature relative to the preceding questions. We will look at some of the methods developed for these.
Outline • Different kinds of gene expression array experiments. • Questions these data can help to address. • Image analysis and data preprocessing issues. • Overview of some analysis methods for differential expression, class discovery, and class prediction.
Image analysis:(for spotted arrays) • Gridding: in order to extract spot intensities it is necessary to accurately identify the location of each of the spots. • Segmentation: it is necessary to identify, within each such location, which pixels correspond to probe hybridized to target. • Intensity extraction: after detecting location, size, and shape of each spot, one needs to calculate the signal (foreground) and the background intensities as well as quality measures at each spot.
Gridding Segmentation Intensity Extraction Image analysis (cont.) Figures from http://www.nhgri.nih.gov/DIR/Microarray/image_analysis.html
Image analysis (cont.) • There are different public and commercial software packages for image analysis, using different algorithms for the 3 steps involved and requiring/allowing different degrees of manual intervention. Moreover, different software might give a more or less copious output in terms of quality measures • For the segmentation step, the following possibilities might be available: • fixed circle • adaptive • histogram • Forintensity extraction there are also various possibilities: • Foreground: sum, mean, median, mode, etc. of pixel intensities; • Background: none, global, local, morphological opening;
S Local background ---- GenePix QuantArray ScanAnalyze
S Morphological non-linear filter on background pixel signal(Spot software) Measures overall baseline background level.
Data flagging • There are artifacts, e.g. specks of dust, scratches, etc. • There are multiple light sources: background, target, target hybridized with sample, array surface • The quality of the image analysis for certain spots might be poor • Some of the quality measures output by the image analysis software can be utilized for flagging • Software packages also differ in the amount and type of quality measures provided • Recently an SVM approach has been proposed to flag data Davison T. “Using Support Vector Machines for the Classification of Data Quality in Microarray Experiments” poster at ASI course, S. Miniato Italy, October 2001 • For short oligonucleotide arrays, see work of Li and Wong (2000, 2001) regarding artifact detection
S Quality measures • Spot • One channel, R or G • Signal/noise ratio • Variation in pixel intensities • Identification of “bad spots” (no signal), etc. • Two channels, R/G • Circularity, etc. • Array • Percentage of spots with no signal • Distribution of spot signal area, etc.
S Normalization: motivation Need to identify and remove systematic sources of variation in the measured intensities, due to one or more of • Different labeling efficiency of the dyes • Separate reverse transcription and labeling • Different scanning parameters • Print-tip-group differences • Spatial effects, e.g. due to the placement of the cover slip • Plate effects Necessary for within and between slides comparisons of expression levels.
Normalization: methods • Multiply all values for an array by the same scaling factor obtained from a given set of spots on the array, e.g. • 1/(total intensity) or 1/(average intensity) or 1/(median intensity) • 1/(mean or median ratio): 2-channel microarrays • 1/(slope of some linear fit) • T. Speed’s group (see Yang et al., 2000) propose various approaches for normalizing (log) ratios(R/G) in 2-channel microarrays, including: • intensity-dependent normalization: the scaling factor depends on the overall intensity of the spot, not just on the array • intensity-and-print-tip-dependent normalization: the scaling factor also depends on the print-tip group • scale normalization (within and between slides) • Li and Wong (2001) propose an approach in the same spirit for short oligonucleotide arrays. See also Astrand’s and Bolstad’s normalization for these.
S MA plots M vs. A log2R vs. log2G M = log2R - log2G, A = (log2R + log2G)/2
S Normalization - lowess Assumption: Changes roughly symmetric at all intensities or few genes change.
S Normalization - print-tip-group Assumption:For every print-tip-group, changes roughly symmetric at all intensities or few genes change.
S MA plot - after print-tip-group normalization
S Scale normalization Before print-tip group normalization After scaled print-tip-group normalization
Which genes to use for normalization • All genes on the array. • Constantly expressed genes (housekeeping). • Controls • Spiked controls • Titration series • Rank invariant set Every normalization method relies on the samples and arrays at hand satisfying certain assumptions. Thus, to judge what is the most appropriate normalization for a given dataset, it is important to ascertain which of the necessary assumptions are satisfied.
Microarray Gene Expression Database group http://www.mged.org International Meetings on Microarray Data Standards, Annotations, Ontologies, and Databases • Develop standards for storing and communicating microarray-based gene expression data • defining the minimal information required to ensure reproducibility and verifiability of results • developing standards for preprocessing and cross-platform data comparison.
Outline • Different kinds of gene expression array experiments. • Questions these data can help to address. • Image analysis and data preprocessing issues. • Overview of some analysis methods for differential expression, class discovery, and class prediction.
Experimental Design Issues Question: Which genes are (relatively) up/down regulated between sample type A and sample type B? • Need replicate (experimental and biological) to assess variability within sample type • In the case of 2-channel microarray experiments, possible experimental designs are (direct comparison) (reference design) n n B A C A C B (B A) n n
Differential Expression: methods. • Claverie (1999), overview paper and method for SAGE • Single-slide methods (2-channel microarrays), e.g. • Chen et al. (1997) • Newton et al. (1999) … • Methods involving replicates • Filter arrays, short oligo arrays, 2-channel arrays with reference design: • Dudoit et al. (2000) (see T. Speed’s group reference) • PaGE (CBIL, Penn Center for Bioinformatics) • SAM (Tusher et al., 2001) … • 2-channel arrays with direct comparison design • Lönnsted and Speed (see T. Speed’s group reference) • SAM with the “one response” mode • Kerr and Churchill (2000), ANOVA
Single-slide methods: limitations • Assumed parametric models. We do not know enoughabout systematic and random variation within a microarray to justify such strong assumptions. • The gene expression data may be too variable for successful identification of differentially expressed genes without replication.