Download
1 / 21
210 likes | 215 Views
This article explains various concepts in statistics including probability calculations, sampling distributions, and confidence intervals. It includes examples and exercises to help understand the topics.

E N D
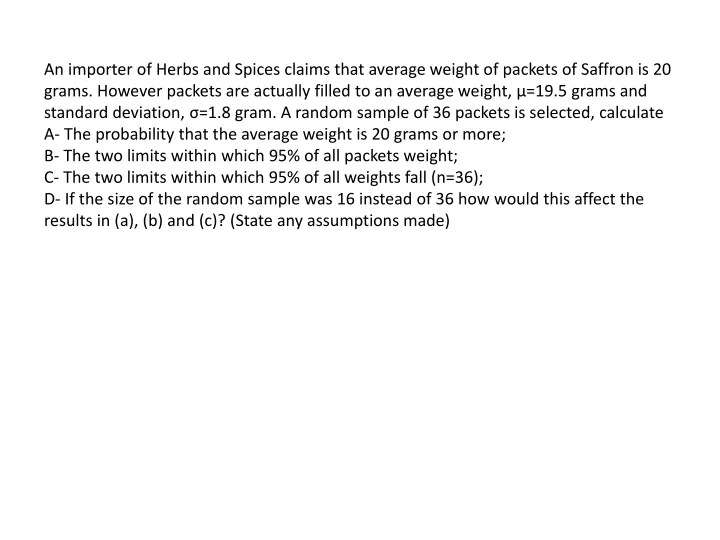
An importer of Herbs and Spices claims that average weight of packets of Saffron is 20 grams. However packets are actually filled to an average weight, μ=19.5 grams and standard deviation, σ=1.8 gram. A random sample of 36 packets is selected, calculate A- The probability that the average weight is 20 grams or more; B- The two limits within which 95% of all packets weight; C- The two limits within which 95% of all weights fall (n=36); D- If the size of the random sample was 16 instead of 36 how would this affect the results in (a), (b) and (c)? (State any assumptions made)
Samples The means of these samples 1 and 3 2 1 and 5 3 1 and 7 4 1 and 9 5 3 and 5 4 3 and 7 5 3 and 9 6 5 and 7 6 5 and 9 7 7 and 9 8
Example 2: Tuition Cost The mean tuition cost at state universities throughout the USA is 4,260 USD per year (2002 year figures). Use this value as the population mean and assume that the population standard deviation is 900 USD. Suppose that a random sample of 50 state universities will be selected. A-) Show the sampling distribution of x̄ (where x̄ is the sample mean tuition cost for the 50 state universities) B-) What is the probability that the random sample will provide a sample mean within 250 USD of the population mean? C-) What is the probability that the simple random sample will provide a sample mean within 100 USD of the population mean?
Example 3: If a random sample of size 30 is taken from binomial distribution with n=9 and p= 0.5 Q: Find the probability that the sample mean exceeds 5.
Example 4: Suppose we have selected a random sample of n=36 observations from a population with mean equal to 80 and standard deviation equal to 6. Q: Find the probability that x̄ will be larger than 82.
Example 5: Ping-Pong Balls The diameter of a brand of Ping-Pong balls is approximately normally distributed, with a mean of 1.30 inches and a standard deviation of 0.04 inch. If you select a random sample of 16 Ping-Pong balls, A-) What is the sampling distribution of the sample mean? B-) What is the probability that sample mean is less than 1.28 inches? C-) What is the probability that sample mean is between 1.31 and 1.33 inches? D-) The probability is 60% that sample mean will be between what two values, symmetrically distributed around the population mean?
Example 6: E-Mails Time spent using e-mail per session is normally distributed, with a mean of 8 minutes and a standard deviation of 2 minutes. If you select a random sample of 25 sessions, A-) What is the probability that sample mean is between 7.8 and 8.2 minutes? B-) What is the probability that sample mean is between 7.5 and 8.0 minutes? C-) If you select a random sample of 100 sessions, what is the probability that sample mean is between 7.8 and 8.2 minutes? D-) Explain the difference in the results of (A) and (C).
Example 6: ELECTION A political pollster is conducting an analysis of sample results in order to make predictions on election night. Assuming a two-candidate election, if a specific candidate receives at least 55% of the vote in the sample, that candidate will be forecast as the winner of the election. If you select a random sample of 100 voters, what is the probability that a candidate will be forecast as the winner when A-) the population percentage of her vote is 50.1% ? B-) the population percentage of her vote is 60% ? C-) the population percentage of her vote is 49% (and she will actually lose the election)? D-) If the sample size is increased to 400, what are your answers to (A) through (C) ? Discuss.
Exercise - 3 An economist is interested in studying the incomes of consumers in a particular region. The population standard deviation is known to be $1,000. A random sample of 50 individuals resulted in an average income of $15,000. What is the upper end point in a 99% confidence interval for the average income?
Exercise - 4 An economist is interested in studying the incomes of consumers in a particular region. The population standard deviation is known to be $1,000. A random sample of 50 individuals resulted in an average income of $15,000. What is the width of the 90% confidence interval?
Exercise - 5 The head librarian at the Library of Congress has asked her assistant for an interval estimate of the mean number of books checked out each day. The assistant provides the following interval estimate: from 740 to 920 books per day. If the head librarian knows that the population standard deviation is 150 books checked out per day, and she asked her assistant for a 95% confidence interval, approximately how large a sample did her assistant use to determine the interval estimate?
Types of Survey Errors • Coverage error • Non response error • Sampling error • Measurement error Excluded from frame Follow up on nonresponses Random differences from sample to sample Bad or leading question
Population Distribution Sampling Distribution Standard Normal Distribution ? ? ? ? ? ? ? ? ? ? Sample Standardize ? ? Z X
Sampling Distribution Properties As n increases, decreases Larger sample size Smaller sample size
Sampling Distribution Properties (i.e. is unbiased) Normal Population Distribution Normal Sampling Distribution (has the same mean) Variation:
How Large is Large Enough? • For most distributions, n ≥ 30 will give a sampling distribution that is nearly normal • For fairly symmetric distributions, n ≥ 15 • For normal population distributions, the sampling distribution of the mean is always normally distributed