Download
1 / 17
170 likes | 272 Views
Section 2.2:. What do samples tell us?. Should gambling be legal?. What were the major ideas from this activity? Finding a proportion for the TRUE population (for everyone or everything) is almost impossible to do. The more samples you take, the more

E N D
Section 2.2: What do samples tell us?
Should gambling be legal? What were the major ideas from this activity? • Finding a proportion for the TRUE population (for everyone or everything) is almost impossible to do. • The more samples you take, the more reliable (less variable) your data is. • The more samples you take, the better it predicts the true population proportion!
Several statisticians will use a fact about a sample to estimate the truth about the whole population. However, in order to do this, it’s important to understand whether a number describes a sample or a population. The analogy below is used by many to remember this vocabulary: “ Parameter” is to “population” as “statistic” is to “sample.”
1. Parameter: p • This is a number that describes the population. • The parameter is a fixed number (in practice we don’t know it’s value, but we try to estimate it using the outcomes of our samples). • This is the proportion of your population.
2. Statistic: p-hat • This is a number that describes the sample. • The value of a statistic is known when we have taken a sample, but it can change from sample to sample. • It is the outcome(s) of taking samples. It is the proportion of your samples. • We use a statistic to estimate an unknown parameter.
Example #1 A random sample of 1000 people who signed a card saying they intended to quit smoking on November 20, 1995 (the day of the “Great American Smoke-out”), were contacted in June 1996. It turned out that 210 (21%) of the sampled individuals had not smoked over the past six months. Specify the population of interest, the parameter of interest, the sample, and the sample statistics in this problem.
Example #2 On Tuesday, the bottles of tomato ketchup filled in a plant were supposed to contain an average of 14 ounces of ketchup. Quality control inspectors samples 50 bottles at random from the day’s production. These bottles contained an average of 13.8 ounces of ketchup. State the value of the parameter and the value of the statistic.
Example #3 On a New York – to – Denver flight, 8% of the 125 passengers were selected for random security screening prior to boarding. According to the Transportation Security Administration, 10% of the airline passengers are chosen for random screening. State the value of the parameter and the value of the statistic.
Example #4 A recent report in the journal Nature examined whether ducks keep an eye out for predators while they sleep. The researchers, from Indiana State University, put four ducks in each of the four plastic boxes, which were arranged in a row. Ducks in the two end boxes slept with one eye open 31.8% of the time, compared to only 12.4% of the time for the ducks in the two center boxes. • State the values of the parameter and state the value of the statistic. • Is this an example of an observational study or a comparative experiment? Explain briefly.
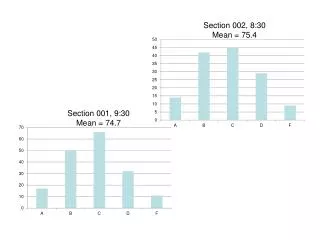
As you noticed with the gambling activity (whether gambling should be legalized), the value of the statistic, p-hat, will vary from sample to sample. Random samples eliminate bias from the act of choosing a sample, but they can still estimate a population proportion badly because of the variability (how scattered the data is) that results when we choose at random. If the variation when we take repeated samples from the same population is too great, we can’t trust the results of any one sample!
A couple of things to keep in mind…back to the gambling discussion! • Larger random samples have less variability (not as scattered) than smaller samples. This is why you collected 10 samples for the gambling activity. What would have happened if you only found one sample and the proportion was 10%? • While you were collecting samples, the proportion p-hat was sometimes higher than 0.6, but sometimes lower than 0.6. Due to the fact that the p-hat values you found were not always too high or too low, p-hat (the statistic) has no bias as an estimator of p (the population’s parameter). This is true for both large and small samples.
Two types of error in estimation: Bias vs. Variability
1. Bias • Bias occurs when there is consistent, repeated deviation of the sample statistics from the population parameter in the same direction when many samples are taken (all p-hat values are understated or overstated). • In order to reduce bias: use random sampling (some statistics will be higher and some lower), so no repeated deviations occur.
2. Variability • Variability describes how spread out the values of the sample statistics are when many samples are taken (large variability means that the result of sampling is not repeatable…it’s not good!). • In order to reduce variability: use a larger sample (or many samples and take the average). Also, check that the instrument used is valid!
What you want… SMALL BIAS! SMALL VARIABILITY!
Visually representing bias and variability using targets. • Bias means the archer systematically misses in the same direction. • Variability means that the arrows are scattered.
Create your own data set of 6-values that holds true for each set of conditions: • Low Variability and Low Bias • Low Variability and High Bias • High Variability and Low Bias • High Variability and High Bias