Download
1 / 13

E N D
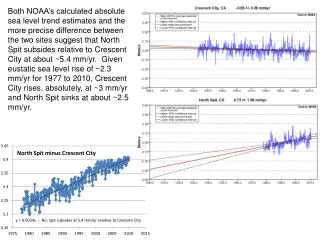
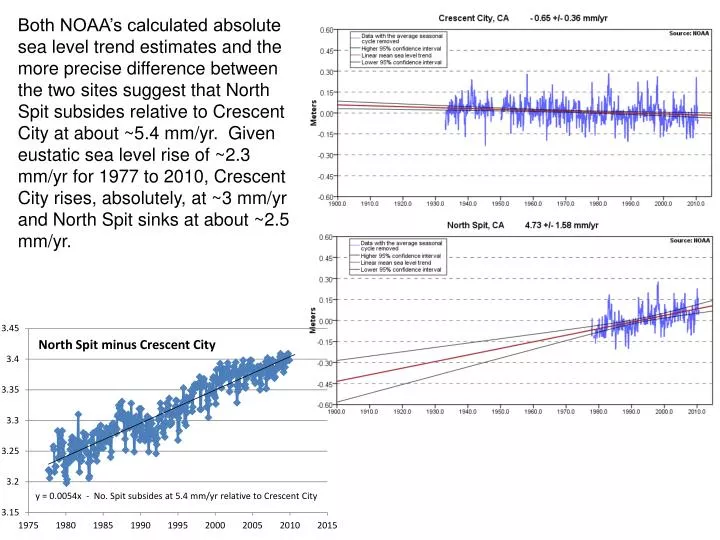
Both NOAA’s calculated absolute sea level trend estimates and the more precise difference between the two sites suggest that North Spit subsides relative to Crescent City at about ~5.4 mm/yr. Given eustatic sea level rise of ~2.3 mm/yr for 1977 to 2010, Crescent City rises, absolutely, at ~3 mm/yr and North Spit sinks at about ~2.5 mm/yr.
Updip Deformation Sources • Interseismic deformation due to plate convergence Trench Central OR Coast
Updip Deformation Sources • Interseismic deformation due to plate convergence Possibly? Crescent City North Spit Trench Trench Central OR Coast
Crustal uplift from sea level change Global sea level change 1950-2000 Church et al. (2004) Observed rates at Seattle, WA gauge match reconstructed data for Cascadia: 2.2 mm/yr 1950- 2000 and 2.0 mm/yr 1900-2000 (Church and White, 2006). Oregon records: 1925 - 2006 Weighted mean of Seattle subsets = 2.28 mm/yr estimated uncertainty = 0.2 mm/yr
We were recently funded by the USGS/NEHRP to conduct a similar study in Western Washington. Colored lines are repeated (at least in part) 1st and 2nd order leveling lines; colors represent different time periods from the 1920s yellow to the late 1980s red (a few short late 1990s lines exist for GPS control). Triangles are tide gauges, with the size and grey scale representing the relative amount and quality of the data. Our goals are to establish 2 NS and 3 EW profiles along which we determine uplift rate to a precision of ~0.4 mm/yr, and to model depth of locking on the subduction zone.
Preliminary reanalysis of the HW101 line from the Strait of Juan de Fuca (BM) to Aberdeen (Ab) supports the hypothesis that at least part of the westernmost coast is subsiding and there are very large gradients in uplift. However, this is based on a short repeat time in the releveling and is a very long distance unsupported by tide gauges to assess cumulative error in the leveling. Tidal records from La Push (LP) and Point Grenville (PG) will confirm (or deny!) this hypothesis, and IF 2nd order leveling lines could be repeated between them and HW101 these tide gauges could stabilize the coast.
Our goal is to get as many tide gauges in the water as possible this summer and complete our analysis in about a year. If we could find partners to place more tide gauges or even relevel critical lines or portions of lines we could do an even better job. In any case we will have a map of uplift and relative sea level rise for the Pacific coast of Washington, the Strait of Juan de Fuca and the east side of the Olympic Peninsula. From this we will make a model for locking along the subduction zone which will allow assessments of the amount of subsidence in the next subduction zone earthquake, when the uplift-masked eustatic sea level rise will catch up in those regions currently being spared from sea level rise by interseismic strain accumulation.