Download
1 / 20
200 likes | 323 Views
EEP 101/Econ 125 lecture 7 Property rights. David Zilberman. Outline. Property rights and the Coase Theorem The economics of clean up and restoration Limited information Political economy models Capture Rent seeking. Property right and the environment.

E N D
EEP 101/Econ 125 lecture 7Property rights David Zilberman
Outline • Property rights and the Coase Theorem • The economics of clean up and restoration • Limited information • Political economy models • Capture • Rent seeking
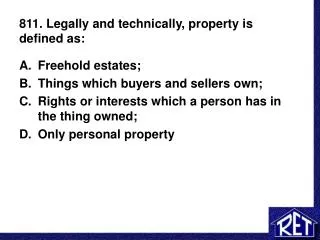
Property right and the environment • Property right define entitlement that can not eb taken away • Polluter may have rights to pollute- • precedent establishes right in many cases • A chemical plant got the right to pollute when a plant is established • Victims( pollutees) may have rights for protection from pollutions • Downstream users have rights to clean water
The Coase theorem • Assumptions • property rights are clear and enfrocable • Full information • Zero transaction costs • Then • No need for intervention in cases of externalities • Pareto optimality • Regardless of initial distribution of rights
Negotiations and the Coase outcomes • Clear property rights lead to Pareto efficient outcomes • The exact distribution of surplus gain depend on negotiation • We assumed the parties are splitting the benefits • In case of polluter rights the pollutee pay the polluters not to pollute • In case of pollutee rights the polluter pays the pollution to pollute
Initial outcome B Pollutee pays CEBD,gains CEFFinal outcome C Polluter gains BCESocial gains FCB Gain to polluters F D $ $ Polluter marginal benefits Marginal pollutee benefits C E A D B Pollution CASE OF POLLUTER RIGHTS
Initial outcome APolluter pays GCDA,gains DCGFinal outcome CPolluter gains GCASocial gain DCA Gain to polluters F D $ $ Polluter marginal benefits Marginal pollutee benefits C E G A D B CASE OF POLLUTEE RIGHTS Pollution
Implications and limitations of Coase theorem • A functioning legal system is key for environmental policy • Externalities-caused by • Missing markets • Undefined property rights • Market failure • The Coase theorem works when • Small number of actor-low transaction costs • It does not work when there are many parties and negotiation and collaboration are costly
Liability rules • Allow violation of property rights but imposes penalties • Polluter has to pay damages for accidental water contamination.Has to pay a penalty for intentional • Pollution tax is a liability payment Negligence Rules: Penalize individuals for not exercising sufficient care in action. Due care standards-set basis for liability A farmer may not be liable for run off damages if she performed due care. Part of policy is establishing these standards
Full Restoration May Be Suboptimal Price MC of Restoration MB of Restoration Q* Quantity Q* = Full Restoration = Optimal Restoration
Waste management • Liability may be retroactive- New owners are liable for pollution of old ones. • It leads to care in purchases of new properties and prevent people from polluting and selling • In cases of ex Soviet Union may prevent development-many sites are worth to buyer less than clean up cost- • Government may pay if public gain from clean up and development is greater than private gain
Point vs. non point source pollution • When pollution can be assigned to pollution we have polluters we have source point • Example-when each smoke stack is monitored • When individual pollution can not be assigned we have non point source • Pollution at point source can be taxed • In case of non point pollution of individuals can not be observed- other action related to pollution can be regulated or taxed
Contamination by firms-point vs non point • Suppose that there are N firms, each firm is index by n who assume values from 1 to N • Pollution of the nth farmer is Zn.It is produced by the input of this farmer Xn.This input is generating output Yn. • The production function of the nth producer is Yn=Fn(Xn). The pollution function of the nth producer is Zn=Gn(Xn) • Suppose output price is P, input price is W and pollution damage per unit is V.
Case of point source • If the policy maker can observe Zn, he will charge the nth firm VZ. It will lead to optimal outcome. • The optimal choice of the firm will be • The optimality is • At optimal outcome • value of marginal benefit of production is equal to • input price plus • marginal pollution damage cost
Example • If • Optimality condition • Implying • If • A tax of $2 will lead to optimality if Zn is observable. • If Zn is not observables but Xn is a tax on input 2VcnXn.It will also be optimal.In our case the input tax is $12.
Heterogeneity • Suppose all firms have the same production function, but vary pollution function. • 50% have cn=1and the other 50% have cn=0 • If the policy maker observes Zn • Firms with cn=1 pay tax of $2 per unit of pollution and produce 3 units making • The clean firms have Xn=.5(20-2)=9 and make • Average income is $54 per firm
Non point source • If only Xn is not observable the policy maker will optimize average behavior • So the tax will be based $2 per unit of output resulting in output of Xn=.5(20-2)/(1+1)=6 • The profit per firm will be • The social welfare will be $72 for clean firms and 0 for dirty ones. Since the cost fo their pollution is 2*36. • Average welfare is $ 36 per firm • Information will generate welfare gain of $9 per firm.
The Gain From Information Avg. MEC MECH MB A High Tax C MECL Avg. Tax E Low Tax B D The area ABC is loss of pollution generated by dirty firms. The area CDE is loss of insufficient pollution by cleaner firms.
Investment in Monitoring • Monitoring of pollution allows discrimination among polluters and non-polluters and increases welfare. • If monitoring cost is greater than the gain from information, do not invest. • Government can induce monitoring by assuming that everyone is a heavy polluter and is being taxed accordingly. Refunds will be issued to firms that prove to be clean. • This leads to an industry of monitoring and environmental auditors.