Download
1 / 36
360 likes | 498 Views
Design of Experiments Lecture I 6/29/05. Review of Error Analysis Theory & Experimentation in Engineering . Some Considerations in Planning Experiments Review of Statistical formulas and theory Begin Statistical Design of experiments (“DOE” or “DOX”). Topics Today.

E N D
Review of Error Analysis Theory & Experimentation in Engineering Some Considerations in Planning Experiments Review of Statistical formulas and theory Begin Statistical Design of experiments (“DOE” or “DOX”) Topics Today
Part 1: Review of Error Analysis • Uncertainty or “random error” is inherent in all measurements • Statistical basis • Unavoidable- seek to estimate and take into account • Can minimize with better instruments, measurement techniques, etc.
Review of Error Analysis • Systematic errors (or “method errors”) are mistakes in assumptions, techniques etc. that lead to non-random bias • Careful experimental planning and execution can minimize • Difficult to characterize; can only look at evidence after the fact, troubleshoot process to find source and eliminate
Why do we need to estimate uncertainty and include in stated experimental values? • Probability of being wrong will influence process and/or financial decisions • Cost / benefit of accepting result as “fact”? • What would be the effect downstream as the uncertainty propagates through the process? • When comparing two values and determining if they are different • Overlap of uncertainty? • What is the probability that the difference is significant?
Stating Results +/- Uncertainty • Rule for Stating Uncertainties • Experimental uncertainties should almost always be rounded to one significant figure. • Rule for Stating Answers • The last significant figure in any stated answer should usually be of the same order of magnitude (in the same decimal position) as the uncertainty. • Express Uncertainty as error bars and confidence interval for graphical data and curve fits (regressions) respectively
Determining Propagated Error:Non-statistical Method • Compute from total differential
Propagated error • OR Can do sensitivity analysis in spreadsheet of other software program • Compute possible uncertainty in calculated result based on varying values of inputs according to the uncertainty of each input • Example: Use “Solver” optimization tool in Excel to find maximum and minimum values of computed value in a cell by varying the value of each input cell • Set constraint that the input values lie in the range of uncertainty of that value
mean standard deviation of each measurement standard deviation of the mean of the measurements Confidence intervals on dependant variable Confidence intervals on regression parameters Or Can Use repeat measurements to estimate uncertainty in a result using probability and statistics for random errors:
Confidence intervals on non-linear regression coefficients • Can be complex- use software but understand theory of how calculated for linear case
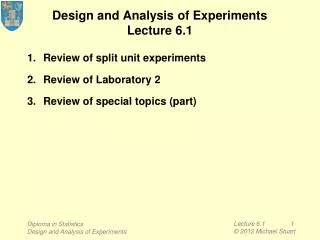
Error bars that represent uncertainty in the dependant variable
How measurements at a given x,y would be distributed for multiple measurements
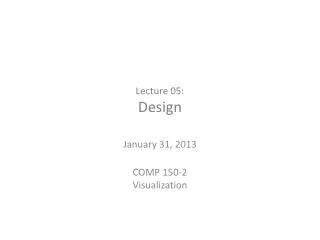
Regression Output in Excel Simple ANOVA- we will be looking at more complex cases in DOE Slope and intercept Confidence limits (+/-) om slope & intercept
Statistical Process Control • Very Widely Used • Used for quality control and in conjunction with DOE for process improvement • Control Charts provide statistical evidence • That a process is behaving normally or if something wrong • Serve as data output (dependant variable )from process in designed statistical experiments
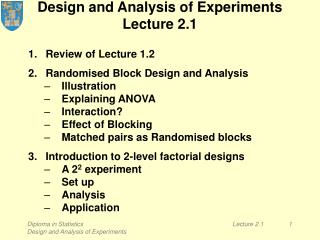
Variation from expected behavior in control charts- similar to regression and point statistics Control Limit is the mean of a well behaved process output (i.e. product) Upper and lower Control Limits represent confidence limit on mean of “well behaved” process ouptut Expect random deviations form mean just like in regression
Theory and Experimentation in Engineering • Two fundamental approaches to problem solving problems in the discovery of knowledge: • Theoretical (physical/mathematical modeling) • Experimental measurement (Most often a combination is used)
Example of combination of theory and experimentation to get semi-empirical correlation
Theoretical Models Simplifying assumptions needed General results Less facilities usually needed Can start study immediately Experimental approach Study the “real world”-no simplifying assumptions needed Results specific to apparatus studied High accuracy measurements need complex instruments Extensive lab facilities maybe needed Time delays from building apparatus, debugging Features of alternative methods
Functional Types of Engineering Experiments • Determine material properties • Determine component or system performance indices • Evaluate/improve theoretical models • Product/process improvement by testing • Exploratory experimentation • Acceptance testing • Teaching/learning through experimentation
Some important classes of Experiments • Estimation of parameter mean value • Estimate of parameter variability • Comparison of mean values • Comparison of variability • Modeling the dependence of dependant Variable on several quantitative and/or qualitative variables
Project/Experiment Planning • Gantt Charts for time management • Experimental design: • Consider goals • Consider what data can be collected. • Difficulty of obtaining data • What data is most important • What measurements can be ignored • Type of data: categorical? Quantitative? • Test to make sure that measurements/apparatus are realizable • Collect data carefully and document fully in ink using bound notebooks. Make copies and keep separately
Preview of Uses for DOE • Lab experiments for research • Industrial process experiments
Four engineering problem classes to which DOE is applied in manufacturing 1. Comparison 2. Screening/ characterization 3. Modeling 4. Optimization
Comparison • Compares to see if a change in a single “factor” (variable) has resulted in a process change (ideally an improvement)
Screening/Characterization • Used when you want to see the effect of a whole range of factors so as to know which one(s) are most important. • Two factorial experiments usually used
Modeling • Used when you want to be able to construct a mathematical model that will predict the effect on a process of manipulating a variables or multiple variables
Optimization • When you want to determine the optimal settings for all factors to give an optimal process response.