Download
1 / 52
520 likes | 635 Views
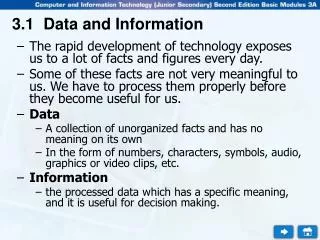
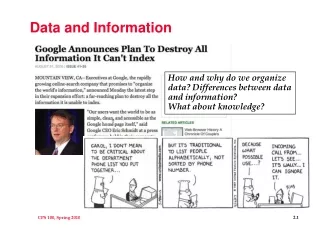
Data and Information Starter. Mr Tettenborn. What are these. 12 17 38 71 They make this 34.5 what will this be then?. Answers. 12,17,38 and 71 are examples of data 34.5 is the average and therefore information. Data, Information. Definitions.

E N D
Data and Information Starter Mr Tettenborn
What are these • 12 • 17 • 38 • 71 • They make this 34.5 what will this be then?
Answers • 12,17,38 and 71 are examples of data • 34.5 is the average and therefore information
Definitions • Data: Raw Facts and figures or a set of values, measurements • Process: Any operation that transfers data into information • Information: Output from an ICT system or data that has been processed and gives us Knowledge • Knowledge (Definition not required for examination): Knowing how to use the information created by an information sysem correctly
Which is the odd one out 59 23 80 15 Examination Grades C E A U
Introduction • In this presentation we cover where data comes from and factors we need to take into account when gathering data for processing
Homework • Complete the GIGO and definitions worksheet • S:\Student Area\Subjects\ICT\Year 12\AS ICT\INFO2 Living in the digital world\INFO 2.2 Data and Information • This will be printed out before next lesson and peer assessed.
Data Sources Data can be collected either: • DIRECTLY • Gathered from an original source or • INDIRECTLY • Gathered from an another source or as a by-product of another operation • In the world of business these would be described as primary and secondary sources of data
Direct (Original) Data Sources • Sale of an item in a supermarket recorded at EFTPOS terminal • Data from sensors e.g. a weather station • Data collected in a survey e.g. a questionnaire or an interview
Indirect Data Sources 1 • Data collected for one purpose and used for another • A credit card company collects data about your spending in order to bill you each month. However, a secondary use of this data is to build up a “profile” of your spending habits. This data can then be used to send you direct marketing about goods and services that may appeal to you. Direct Use of Data Customer Billing Credit Card Transaction Indirect Use of Data Direct Marketing
Indirect Data Sources 2 • Purchased data/data passed on • There are a number of ways data can be acquired from 3rd parties and then used for a different purpose • A good example is the electoral roll. Its main use is to gather data about who is eligible to vote. However, marketing companies make extensive use of the roll to target customers.
Task • Go to : S:\Student Area\Subjects\ICT\Presentations\Unit 1 Hardware\ Input Devices. Read through presentation and make notes • Create a spider diagram showing how Data Can arise (see p130)
Encoding Task: • What formats are the following examples of • .txt • .csv • .jpg • .mpg • .bmp • .wav • .midi
Coding Data • Before being stored in a computer information can be coded as data e.g. • M or F • Mo, Tu, We, Th, Fr, Sa, Su • I, II, IIIM, IIIN, IV, V • S, M, L, XL, XXL • In the picture shown we can see the date code for the tyre This represents the eighth week of 2006
Benefits of Coding • Less storage space is required • M and F require less storage space than male and female • Faster data input • See above • Validation is easier • With a limited number of codes it is easier to match them against rules to check they are entered correctly
Drawbacks of Coding • Precision of data can be lost (coarsened) • In the example all shades of blue are coded as “blue” • The user needs to know the codes used • How many of these top level domains do you know? • au, ch, de, ie, pk, fr, il, lk, es Data in Pink Blue Black Blue Stored data
Coding Value Judgements • Coding value judgements can be a particular problem as they are subject to personal opinion • What do you think of this presentation? • Good? Average? Poor? • One person’s good may be another person’s poor!!! • Value judgements are very difficult to encode without some coarsening (loss of detail) • How would you improve the analysis? What are the time/cost implications?
Task • Create a data entry form for evaluating how successful students feel their Year 12 Examinations were.
Quality of the Data Source 1 • GIGO (Garbage In Garbage Out) • If data input is poor the resulting information output will be poor i.e. corrupt, inaccurate etc. • Can you think of any “real life” examples? Garbage In Garbage Out
Quality of the Data Source 2 Examples of GIGO can include: • Unreliable questionnaires/surveys • e.g. inappropriate samples, badly worded questions etc. • Incorrectly calibrated instruments • e.g. an incorrectly calibrated balance will give incorrect measures of mass • Human error • e.g. transcription errors when entering data • Incomplete data sets • e.g. failing to account for “shrinkage” when measuring supermarket stock
Types of Data • Numbers • Text • Sound • MIDI (Musical Instrument Digital Interface) • Bit-mapped graphics • Vector graphics
Computers use a number system called binary. It uses two digits (0 and 1) Known as BIT (BInary digiT) Bits are generally grouped together as 8 bits (called a byte) Internal Data Storage
Decimal Numbers (Base 10) Let’s look at:- Remember your earliest sums in primary school ‘Hundreds, Tens & Units’ H T U 100 10 1 100 10 1 6 5 3 which becomes:- (100 x 6) = 600 (10 x 5) = 50 (1 x 3) = 3 Total = 65310 Notice how the numbers (place values) multiply by 10 as we move from right to left
Binary Numbers (Base 2) Let’s look at:- Instead of : ‘Hundreds, Tens & Units’ we have: ‘Eights, Fours, Twos and Units’ 8 4 2 1 8 4 2 1 1 1 0 1 which becomes:- (8 x 1) = 8 (4 x 1) = 4 (2 x 0) = 0 (1 x 1) = 1 Total = 1310 Notice how the numbers (place values) multiply by 2 as we move from right to left
The pattern of 0’s and 1’s may be:- • A number • the number ‘24’ • A character • the letter ‘A’ • A program instruction • the instruction ‘Add’ • A sound • MP3 file • Image(s) • Jpg, Bmp. Video.
ASCII Code • American Standard Code for Information Interchange • Character ASCII Char ASCII Char ASCII Char ASCII • space 0100000 8 0111000 P 1010000 h 1101000 • ! 0100001 9 0111001 Q 1010001 i 1101001 • " 0100010 : 0111010 R 1010010 j 1101010 • £ 0100011 ; 0111011 S 1010011 k 1101011 • $ 0100100 < 0111100 T 1010100 l 1101100 • % 0100101 = 0111101 U 1010101 m 1101101 • & 0100110 > 0111110 V 1010110 n 1101110 • ' 0100111 ? 0111111 W 1010111 o 1101111 • ( 0101000 @ 1000000 X 1011000 p 1110000 • ) 0101001 A 1000001 Y 1011001 q 1110001 • * 0101010 B 1000010 Z 1011010 r 1110010 • + 0101011 C 1000011 [ 1011011 s 1110011 • , 0101100 D 1000100 \ 1011100 t 1110100 • - 0101101 E 1000101 ] 1011101 u 1110101 • . 0101110 F 1000110 ^ 1011110 v 1110110 • / 0101111 G 1000111 _ 1011111 w 1110111
Input via a microphone - converted from analogue to digital by taking samples Higher sampling rate = Better sound quality Digitised sound
MIDI (Musical Instrument Digital Interface) • Allows the computer to communicate with musical instruments • Records information about each note • Very compact format - takes around 1/20th of disk space than “recorded” sound
Bit-mapped graphics • Data about each pixel (picture element) is stored • even if the element contains just white space • Bigger the picture, the more pixels are stored thus larger file size • Do not scale well - gives jagged edges
Vector Graphics • Graphics represented by recording geometric data • A line is defined by • End-points • colour • width • Can be re-sized without distortion • Creates smaller files
Encoding Task: • What formats are the following examples of • .txt • .csv • .jpg • .mpg • .bmp • .wav • .midi
Objectives: • Understand that information is a commodity and as such can have a monetary value, the level of which depends on • its accuracy, • its potential use and • its particular intended use. • Describe the overheads involved in ensuring that information is up-to-date.
Objectives: • Understand that information is a commodity and as such can have a monetary value, the level of which depends on • its accuracy, • its potential use and • its particular intended use. • Describe the overheads involved in ensuring that information is up-to-date.
VALUE OF INFORMATION • Information has a value • Often when a company goes bankrupt the value of the database is more than of the company! • However, for information to be valuable it must be… • Accurate • Up to date • Relevant
Accurate • Valuable information is accurate: • It has been collected carefully • It has been checked for errors • It is updated regularly
Up to Date • Valuable information is up to date: • Some data has relevance over a long period of time eg. Geological data, historical data etc • Other data ages very quickly eg. stock and share prices, weather data etc • Date stamping helps to prevent management decisions being based on very out-of-date information.
Relevant • Valuable information must be relevant for a particular use • Eg. information intended for a branch manager of a supermarket showing till usage to allow them to allocate staff over a weekly period would not be of use to the Regional manager wanting a view of the efficiency of all branches
Also …..complete • Valuable information contains all relevant data. • Eg. Information on car ownership has much more value if it includes: • When the car was bought • Where it was bought • Amount of money spent
… from a reliable source • The Internet has shown the value of reliable sources • Firms like Reuters (www.reuters.com) have a good reputation – so charge more for information. • Stocks and Share info – price predictions etc. particularly vulnerable to poor info.
WHY IS INFORMATION VALUABLE? • For Marketing… • Who are the important customers? • What characteristics do the customers have? • Who could be potential customers? • Can we target new products to specific customers? • Aid efficiency… • Stock tracking • Just In Time ordering
WHY IS INFORMATION VALUABLE? • The information provided by a system could do some of the following: • Reduce costs • Eliminate loses • Reduce wastage • Use resources more effectively • Provide better management information to aid more accurate decision making.
COSTS OF INFORMATION • Collecting the data • Forms have to be printed and staff have to collect this information • Data conversion for direct input • Involves converting the data into a computer readable form. • If special forms are used that contain data capable of being read directly by the computer, then these costs can be reduced.
COSTS OF INFORMATION • Frequency of Collecting • The more often data is collected, the more likely it is to be up to date, but… • Collecting data too frequently would be expensive, so a compromise needs to be reached. • Control Mechanisms • Control mechanisms prevent the information from being seen by anyone who shouldn’t see it. • Information is a marketable commodity and its protection costs money.
COSTS OF INFORMATION • Validation • Data being entered into a system is subjected to validation checks. • Some of the data will be rejected. • In some systems, data which fails the validation checks will need to be investigated manually. • This involves further costs.
COSTS OF INFORMATION • Frequency of the processing cycle • To keep information up to date it is necessary to perform some processing • This ties up computing time and other resources. • It is therefore necessary to restrict the frequency of the processing. • Need to strike a balance
COSTS OF INFORMATION • Output • Printing out of stock lists prevents the printers from being used for other purposes. • The large volumes of paper used costs money… • There are also the cost of electricity, and toner or ink jet cartridges. • The costs of all these may restrict the style or format of the output and its frequency.
Task: • Draw Out the Processing Diagram on page 132 giving examples of where each way is used. • Answer the questions on page 134 • Draw a spider diagram on how data can arise • Design a poster for quality of information. • Complete Data Worksheet in sahred area: (S:\Student Area\Subjects\ICT\Year 12\AS ICT\INFO2 Living in the digital world\INFO 2.2 Data and Information)