Download
1 / 24
240 likes | 338 Views
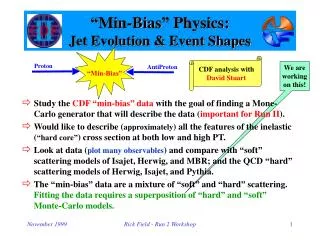
“Min-Bias” Physics: Jet Evolution & Event Shapes. CDF analysis with David Stuart. We are working on this!. Study the CDF “min-bias” data with the goal of finding a Mone-Carlo generator that will describe the data ( important for Run II ).

E N D
“Min-Bias” Physics:Jet Evolution & Event Shapes CDF analysis with David Stuart We are working on this! • Study the CDF “min-bias” data with the goal of finding a Mone-Carlo generator that will describe the data (important for Run II). • Would like to describe (approximately) all the features of the inelastic (“hard core”) cross section at both low and high PT. • Look at data (plot many observables) and compare with “soft” scattering models of Isajet, Herwig, and MBR; and the QCD “hard” scattering models of Herwig, Isajet, and Pythia. • The “min-bias” data are a mixture of “soft” and “hard” scattering. Fitting the data requires a superposition of “hard” and “soft” Monte-Carlo models. Rick Field - Run 2 Workshop
“Soft” Proton-AntiprotonCollisions Isajet and Herwig “min-bias” and MBR are “Soft” scattering models • In a “soft” collision the proton and antiproton ooze through each other and break apart with no hard scattering. • Isajet “min-bias”, Herwig “min-bias” and the Rockefeller MBR program are models (i.e. parameterizations) of “soft” collisions. • At 1.8 TeV the “Soft” models have about 4 charged particles per unit rapidity with a <PT> of around 500 MeV and no correlations except for resonances and momentum conservation. Rick Field - Run 2 Workshop
Charged ParticleRapidity Distribution Monte-Carlo events are required to satisfy the CDF min-bias trigger 4 charged particles per unit rapidity • Plot shows charged particle pseudo-rapidity distribution for 1.8 TeV proton-antiproton “min-bias” collisions. • The data (squares) are from a CDF publication and the curves are the Monte-Carlo predictions of Herwig and Isajet “soft” scattering and the Rockefeller MBR “soft” scattering. • Plot shows dNchg/dh for all charged particles (PT > 0 GeV). Rick Field - Run 2 Workshop
“Hard” Proton-AntiprotonCollisions The “underlying event” consists of the beam-beam remnants and initial-state radiation • Illustration of a proton-antiproton collision in which a “hard” 2-to-2 parton scattering with transverse momentum, PT(hard), has occurred (we take PT(hard) > 3 GeV). • Isajet, Herwig, and Pythia are QCD “hard” scattering Monte-Carlo models. Isajet 7.32 Herwig 5.9 Pythia 6.115 Pythia 6.125 Pythia No MS Rick Field - Run 2 Workshop
“Hard” ScatteringPT(hard) Cut-off Perturbative inelastic cross section diverges as PT(hard) becomes small. • The inelastic cross section has a single-diffractive, double-diffractive, and “hard core” component as follows: s(inelastic) = sHC + sSD + sDD • For proton-antiproton collisions at 1.8 TeV: s(inelastic) = 60 mb, sSD = 9 mb, sDD = 1 mb, and sHC = 50 mb. • Of course, “hard core” does not necessarily mean “hard” scattering. Select PT(hard) > 3 GeV for this study. Single Diffraction Double Diffraction Rick Field - Run 2 Workshop
Multiple PartonInteractions Pythia uses multiple parton interactions to enhace the underlying event. • Pythia uses multiple parton scattering to enhance the underlying event. • Isajet and Herwig do not include multiple parton interactions. Pythia 6.115 and 6.125 differ in the amount of multiple parton interactions. Isajet 7.32 Herwig 5.9 Pythia 6.115 Pythia 6.125 Pythia No MS No multiple parton interactions. Rick Field - Run 2 Workshop
Min-Bias DataProcedure Theory Monte-Carlo Min-Bias Data Field-Stuart • Zero or one vertex • |zc-zv| < 2 cm, |CTC d0| < 1 cm • Require PT > 0.5 GeV, |h| < 1 • Errors include both statistical and correlated systematic uncertainties Make efficiency corrections Select “clean” region • Require satisfy Min-Bias trigger • Require PT > 0.5 GeV, |h| < 1 • Assume a uniform CTC efficiency of 92% • Errors (statistical plus systematic) of around 5% compare Corrected theory Uncorrected data Rick Field - Run 2 Workshop
Define “Jets” as CircularRegions in h-f Space “Jets” contain particles from the underlying event in addition to particles from the outgoing partons. • Order Charged Particles in PT (|h| < 1 PT > 0.5 GeV). • Start with highest PT particle and include in the “jet” all particles (|h| < 1 PT > 0.5 GeV) within radius R = 0.7. • Go to next highest PT particle (not already included in a previous jet) and include in the “jet” all particles (|h| < 1 PT > 0.5 GeV) within radius R = 0.7 (not already included in a previous jet). • Continue until all particles are in a “jet”. • Maximum number of “jet” is about 2(2)(2p)/(p(0.7)2) or 16. 6 particles 5 “jets” Rick Field - Run 2 Workshop
The Evolution of “Jets”from 0.5 to 50 GeV QCD “hard” scattering predictions of Herwig 5.9, Isajet 7.32, and Pythia 6.115 • Compares data on the average number of charged particles within Jet#1 (leading jet, R = 0.7) with the QCD “hard” scattering predictions of Herwig 5.9, Isajet 7.32, and Pythia 6.115. • Use the JET20 data to extend the range to 0.5 < PT(jet#1) < 50 GeV. Plot shows <Nchg(jet#1)> versus PT(jet#1). • Only charged particles with |h| < 1 and PT > 0.5 GeV are included and the theory has been corrected for efficiency. JET20 data connects on smoothly to the Min-Bias data Local “Jet” Observable Rick Field - Run 2 Workshop
Jet#1 “Size” vs PT(jet#1) Isajet 7.32 JET20 data connects on smoothly to the Min-Bias data • Compares data on the average radius containing 80% of the particles and 80% of the PT of Jet#1 (leading jet) with the QCD “hard” scattering predictions of Herwig 5.9. • Use the JET20 data to extend the range to 0.5 < PT(jet#1) < 50 GeV. Plot shows <R(jet#1)> versus PT(jet#1). • Only charged particles with |h| < 1 and PT > 0.5 GeV are included and the theory has been corrected for efficiency. Pythia 6.115 Herwig 5.9 Local “Jet” Observable Rick Field - Run 2 Workshop
Charged Multiplicityversus PT(jet#1) JET20 data connects on smoothly to the Min-Bias data • Plot shows <Nchg> versus PT(jet#1). Each point corresponds to the <Nchg> in a 1 GeV bin (including jet#1). • Only consider charged particles with |h| < 1 and PT > 0.5 GeV where the efficiency is good and use the JET20 data to extend the range to 0.5 < PT(jet#1) < 50 GeV. Global Observable Rick Field - Run 2 Workshop
Distribution of NchgRelative to Jet#1 • Look at the charged multiplicity flow in f relative to the direction of jet#1 (|h| < 1 PT > 0.5 GeV). Use the JET20 data to extend the range to 0.5 < PT(jet#1) < 50 GeV. • Define “Toward” |f-fjet| < 60o (includes jet#1), “Transverse” 60o < |f-fjet| < 120o, and “Away” |f-fjet| < 120o region. • Plot shows <Nchg> in the three regions versus PT(jet#1). Underlying event “plateau” Rick Field - Run 2 Workshop
Shape of an AverageEvent with PT(jet#1) = 20 GeV Includes Jet#1 Underlying event “plateau” Remember |h| < 1 PT > 0.5 GeV Shape in Nchg Rick Field - Run 2 Workshop
“Height” of the UnderlyingEvent “Plateau” Implies 1.09*3(2.4)/2 = 3.9 charged particles per unit h with PT > 0.5 GeV. Implies 2.3*3.9 = 9 charged particles per unit h with PT > 0 GeV which is a factor of 2 larger than “soft” collisions. Rick Field - Run 2 Workshop
Distribution of PTsumRelative to Jet#1 • Look at the PT flow in f relative to the direction of jet#1 (|h| < 1 PT > 0.5 GeV). Use the JET20 data to extend the range to 0.5 < PT(jet#1) < 50 GeV. • Define “Toward” |f-fjet| < 60o (includes jet#1), “Transverse” 60o < |f-fjet| < 120o, and “Away” |f-fjet| < 120o region. • Plot shows <PTsum> in the three regions versus PT(jet#1). Underlying event “plateau” Rick Field - Run 2 Workshop
Shape of an AverageEvent with PT(jet#1) = 20 GeV Includes Jet#1 Underlying event “plateau” Remember |h| < 1 PT > 0.5 GeV Shape in charged PT Rick Field - Run 2 Workshop
Distribution of NchgRelative to Jet#1 Isajet 7.32 • Look at the charged multiplicity flow in f relative to the direction of jet#1 (|h| < 1 PT > 0.5 GeV). Use the JET20 data to extend the range to 0.5 < PT(jet#1) < 50 GeV. • Define “Toward” |f-fjet| < 60o (includes jet#1), “Transverse” 60o < |f-fjet| < 120o, and “Away” |f-fjet| < 120o region. • Plot shows <Nchg> in the three regions versus PT(jet#1) compared with the QCD “hard” scattering predictions of Herwig 5.9, Isajet 7.32, and Pythia 6.115. Pythia 6.115 Herwig 5.9 Rick Field - Run 2 Workshop
“Transverse” Nchgversus PT(jet#1) Isajet 7.32 • Look at the charged multiplicity flow in f relative to the direction of jet#1 (|h| < 1 PT > 0.5 GeV). Use the JET20 data to extend the range to 0.5 < PT(jet#1) < 50 GeV. Define “Transverse” 60o < |f-fjet| < 120o. • Plot shows “Transverse” <Nchg> in the vs PT(jet#1) compared to the QCD “hard” scattering predictions of Herwig 5.9, Isajet 7.32, and Pythia 6.115. Pythia 6.115 Herwig 5.9 Rick Field - Run 2 Workshop
“Transverse” PTsumversus PT(jet#1) Isajet 7.32 • Look at the charged PT flow in f relative to the direction of jet#1 (|h| < 1 PT > 0.5 GeV). Use the JET20 data to extend the range to 0.5 < PT(jet#1) < 50 GeV. Define “Transverse” 60o < |f-fjet| < 120o. • Plot shows “Transverse” <PTsum> in the vs PT(jet#1) compared to the QCD “hard” scattering predictions of Herwig 5.9, Isajet 7.32, and Pythia 6.115. Pythia 6.115 Herwig 5.9 Rick Field - Run 2 Workshop
“Transverse” Nchgversus PT(jet#1) • Look at the charged multiplicity flow in f relative to the direction of jet#1 (|h| < 1 PT > 0.5 GeV). Use the JET20 data to extend the range to 0.5 < PT(jet#1) < 50 GeV. Define “Transverse” 60o < |f-fjet| < 120o. • Plot shows “Transverse” <Nchg> in the vs PT(jet#1) compared to the QCD “hard” scattering predictions of four versions of Pythia (6.115, 6.125, no multiple interactions). 6.115 No multiple scattering 6.125 Rick Field - Run 2 Workshop
“Transverse” PTsumversus PT(jet#1) • Look at the charged PT flow in f relative to the direction of jet#1 (|h| < 1 PT > 0.5 GeV). Use the JET20 data to extend the range to 0.5 < PT(jet#1) < 50 GeV. Define “Transverse” 60o < |f-fjet| < 120o. • Plot shows “Transverse” <PTsum> in the vs PT(jet#1) compared to the QCD “hard” scattering predictions of four versions of Pythia (6.115, 6.125, no multiple interactions). 6.115 No multiple scattering 6.125 Rick Field - Run 2 Workshop
“Min-Bias” Physics:Summary & Conclusions “Soft” versus “Hard” Collisions • The “soft” Monte-Carlo models do not describe the Min-Bias data because the “soft” models have no “hard” scattering and no “jets” and the data show “jet” structure for PTmax > 1 GeV. • The QCD “hard” scattering models (with PT(hard) > 3 GeV) qualitatively fit the data for PTmax or PTjet greater than about 2 GeV. • Below 2 GeV that data are a mixture of “hard” and “soft” and to describe this region we will have to combine a model for the “soft” collisions with a QCD perturbative Monte-Carlo model of the “hard” collisions. We are working on this! Rick Field - Run 2 Workshop
“Min-Bias” Physics:Summary & Conclusions The Evolution of “Jets” • Charge Particle “Jets” (R = 0.7) are “born” somewhere around PT(jet) of about 1 GeV with, on the average, about 2 charged particles, and grow to, on the average, about 10 charged particles at 50 GeV. • The QCD “hard” scattering Monte-Carlo models agree qualitatively well with the multiplicity distribution of the charged particles within a “jet”, the flow of charged multiplicity and PTsum around the jet direction, the “size” of the jets, and with the charged jet “fragmentation functions”. They agree as well with 2 GeV “jets” as they do with 50 GeV “jets”! • The “jets” in the Min-Bias data are simply the extrapolation (down to small PT) of the high transverse momentum “jets” observed in the JET20 data. Our analysis suggests that at 1.8 TeV “hard” scattering makes up at least one-half of the “hard core” inelastic cross section. At the LHC, lots of “min-bias” events will contain 20 GeV “jets”! Rick Field - Run 2 Workshop
“Min-Bias” Physics:Summary & Conclusions The “Underlying Event” • The “underlying event” is formed from the “beam-beam remnants”, initial-state radiation, and possibly from multiple parton interactions.. • The Min-Bias data show that the charged multiplicity in the “underlying event” grows very rapidity with PTmax or with PT(jet#1) and then forms an approximately constant “plateau”. The height of this “plateau” is at least twice that observed in “soft” collisions at the same corresponding energy. • None of the QCD Monte-Carlo models correctly describe the structure of the underlying event seen in the data. Herwig 5.9 and Pythia 6.125 do not have enough activity in the underlying event. Pythia 6.115 has about the right amount of activity in the underlying event, but as a result produces too much overall multiplicity. Isajet 7.32 has a lot of activity in the underlying event, but with the wrong dependence on PT(jet#1). Rick Field - Run 2 Workshop