Download
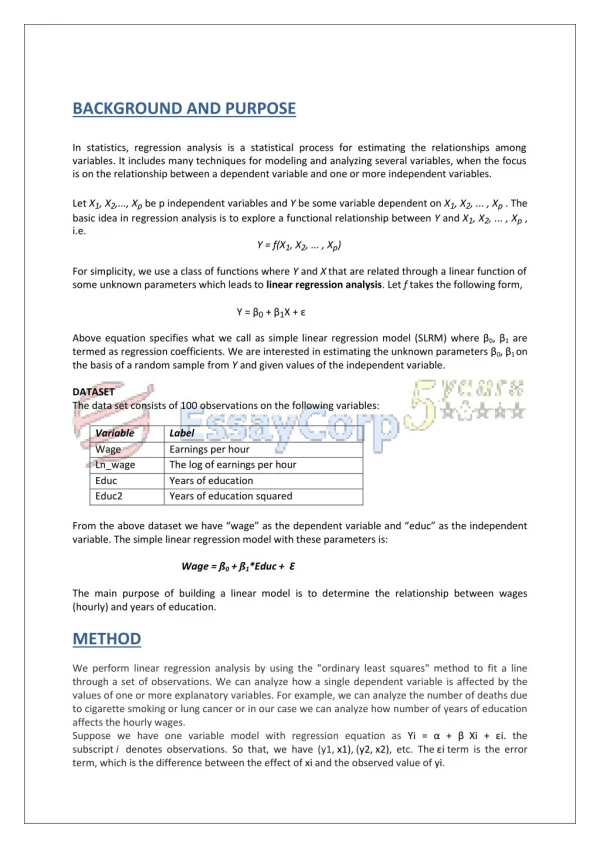
1 / 18
210 likes | 465 Views
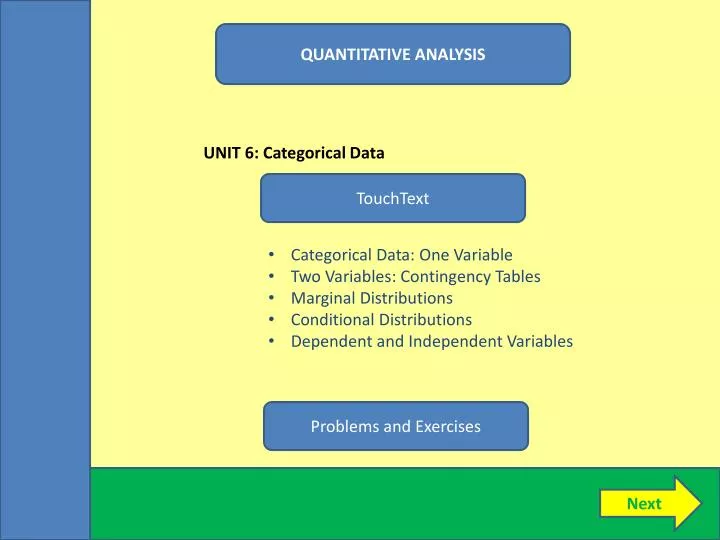
QUANTITATIVE ANALYSIS. UNIT 6: Categorical Data. TouchText. Categorical Data: One Variable Two Variables: Contingency Tables Marginal Distributions Conditional Distributions Dependent and Independent Variables. Problems and Exercises. Next. What Is Categorical Data?.

E N D
QUANTITATIVE ANALYSIS UNIT 6: Categorical Data TouchText • Categorical Data: One Variable • Two Variables: Contingency Tables • Marginal Distributions • Conditional Distributions • Dependent and Independent Variables Problems and Exercises Next
What Is Categorical Data? Categorical Data is qualitative (words), not quantitative (numbers). Dictionary Examples of Categorical Data: Gender: (male/female) Marital Status: (single/married/separated) School Year: (freshman, sophomore, junior, senior) Quantitative data can be made into categorical data by grouping the data. Example: (Quantitative) Age: (15, 40, 59, 72, etc.) (Categorical) Age Groups: (17 and below; 18-45, 46-65, 66 and above) Take Notes Back Next
Categorical Data: 1 Variable (Table) When there is only one qualitative variable, one can create a Frequency Distribution (numbers, #) or Relative Frequency Distribution (percentages, %), just as presented in Unit 1. Dictionary Example: Age of cinema goers. Take Notes Back Next
Categorical Data: 1 Variable (Chart) Bar Charts are typically used to visually represent the data. Frequency Distribution Relative Frequency Distribution Dictionary Take Notes Back Next
Categorical Data: 2 Variables When there are two (2) categorical variables for each observation, a Two-Way Contingency Table is commonly used to organize the data. Dictionary Example: Grades in a class of 148 students. Grand Total • Example: If a female in the class received a “C” grade, she would be counted here. Take Notes Back Next
Marginal Distributions Marginal Distributions show the relative frequency of one categorical variable only, ignoring the other. From the contingency table, they are calculated from the row or column totals on the (bottom and right) margins of the table. Dictionary Example: Marginal Distribution for Grades Take Notes Back Next
Marginal Distributions (cont.) Example (continued): Marginal Distribution for Gender (Sex) Dictionary Marginal Distributions must always sum to 100%. One way to think about marginal distributions is that if you only had one variable – in this case gender – then this would be its relative frequency distribution. Take Notes Back Next
Conditional Distributions Conditional Distributions are relative frequency distributions for one categorical variable, given the value(s) of the other categorical variable. Dictionary Example: A Thai university has three campus locations (Bangkok, Chiang Mai and Chon Buri) and offers three courses (Business, Tourism, and Design). The enrollment numbers are provided below. Total enrollment is 958 students. Take Notes Back Next
Conditional Distributions Example (cont.): What are the conditional distributions for campus location, given that you know the course? Dictionary For example, for the Tourism course, the (conditional) distribution of students across campuses is: Conditional Distributions 42.1% = 141/335 17.0% = 57/335 40.9% = 137/335 100% = 335/335 So, for example, one could say… “Of the Tourism students, 42.1% are studying in Bangkok, 17.0% in Chiang Mai, and 40.9% in Chon Buri.” Take Notes Back Next
Conditional Distributions (continued) Example (cont.): What are the conditional distributions for students, given that you know the campus? Dictionary 65.4% = 364/557 25.3% = 141/557 9.3% = 52/557 100% = 557/557 For example, for the Bangkok campus, the (conditional) distribution of students across courses is: So, for example, one could say… “On the Bangkok campus, 65.4% of the students are studying Business, 25.3% are studying Tourism, and only 9.3% are studying Design.” Take Notes Back Next
Plotting Marginal Distributions MS Excel allows one to plot not only a single marginal distribution (left), but also ALL marginal distributions at once (right). Conditional Distribution (Bangkok ONLY) Conditional Distribution (ALL Campuses) Dictionary * On the right, you can tell that this is a conditional distribution of course enrollment given the campus location, because of the bar color scheme: blue for Bangkok, red for Chiang Mai, and green for Chon Buri. Take Notes Back Next
Dependent Data In the previous example, it was apparent that the Bangkok campus has a concentration of Business students, Chiang Mai is somewhat evenly divided, and Chon Buri has a concentration of Tourism students. Dictionary It is likely that students choose their campus in part by what course they want to study. We would say that which campus a student chooses depends upon what course that student wants to take. When one (categorical) variable affects the likely value of another variably, the on variable is said to be a Dependent Variable. Take Notes Back Next
Independent Data When one variable provides no information about the value of the other variable, the variables are said to be Independent of one another. Dictionary With categorical data, to check for independence, calculate the conditional frequency distributions, and determine whether or not the relative frequency distributions for each category are the same. (See example to follow.) * The idea of (in-) dependent variables will be explored further later in the course. For now, though, think about the relationship between dependence and causality. If two variables are not independent, which variable is influencing the other variable? Take Notes Back Next
Independent Variables: Example Example: We wish to know whether a student’s gender is independent of what transportation – car or motorcycle - the student takes to school. Dictionary Conditional Distribution Contingency Table (given gender) 56.5% of males drive a car, as do 56.5% of females. So knowing a student’s gender provides no information about what transportation the student uses. Conditional Distribution (given transportation) 25% of car drivers are males, as are 25% of moto drivers. So knowing what kind of transportation the student uses provides no information about what gender the student is. Independent Variables! Take Notes Back Next
Simpson’s Paradox (Based Upon A True Story) Situation: A university has only two courses of study (or “majors”), Pre-Medicine and Sociology. The two courses (or “faculty) conduct their own admission policies (i.e. students apply to the course, not to the university). Dictionary Based upon these acceptance rates (below), female students complained to the university that they were being discriminated against, because their over-all admission rate (38.3%) was lower than the men’s rate (57.3%). Do you agree or dis-agree with this conclusion? Explain. Take Notes Back Next
Simpson’s Paradox Answered DISAGREE! One has to keep Pre-Medicine and Sociology separate, because their admissions policies are separate. Dictionary Actually, the acceptance rate is higher for women in both programs! The problem is that most women are applying for Pre-Medicine, which is a very difficult program for anyone (male or female) to get in to. Men, on the other hand, are mostly applying for sociology, which is an easy program to get in to for anyone. Take Notes Back Next
End of Unit 6 Questions and Problems The following problems require the calculation of various statistics using MS Excel. The problems are linked to actual Excel spreadsheets, where students should do their work. Dictionary In this example, 475 male and female students, from both high school and university, were sampled and asked what their most common activity is in the evening when they are finished eating dinner. The responses were as follows. Continued … Take Notes Back Next
End of Unit 6 Questions and Problems Calculate the marginal distribution (%) for activity. Calculate the marginal distribution (%) for student type. Calculate the conditional distributions (%) for activity given the student type. Calculate the conditional distributions (%) for student type given the activity. If the student is a high school boy, what is the likelihood (%) that he will be using his computer? If the student is a university woman, what is the likelihood (%) that she will be on the phone? If the student is doing his/her homework, what is the likelihood (%) that the student is a university man? If the student is watching TV, what is the likelihood (%) that the student is a high school girl? If a student were chosen at random, what is the likelihood (%) that he is a high school boy who would be watching TV? If a student were chosen at random, what is the likelihood (%) that she is a high school girl who would be doing her homework? Dictionary Take Notes Back End