Download

1 / 15
160 likes | 371 Views
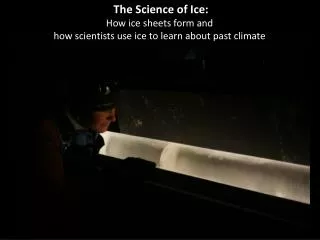
Ice Sheets and Landsat. Robert Bindschadler NASA Goddard SFC. Some Cold Hard Facts. Ice Sheets 10% of land area is ice covered Sea Level Ice sheets hold 70 meters of sea level equivalent Variation of Sea Level -125 meters to +5 meters Rate of Sea Level Change

E N D
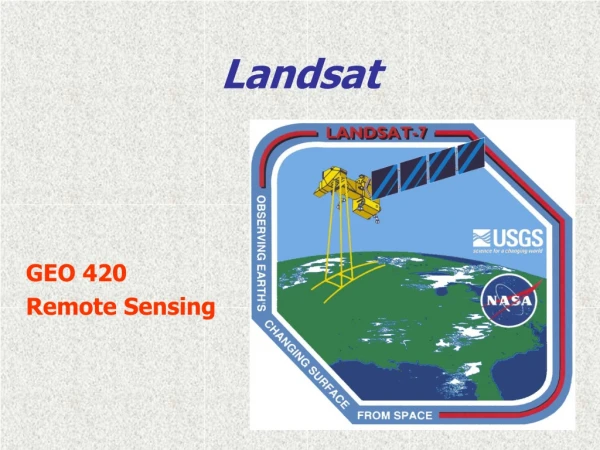
Ice Sheets and Landsat Robert Bindschadler NASA Goddard SFC
Some Cold Hard Facts • Ice Sheets • 10% of land area is ice covered • Sea Level • Ice sheets hold 70 meters of sea level equivalent • Variation of Sea Level • -125 meters to +5 meters • Rate of Sea Level Change • 3 mm/yr. (50% rate increase in last decade)
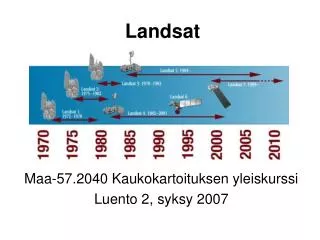
Landsat Image Mosaic of Antarctica • 1131 Landsat scenes (+ 2 ASTER) • circa 2000 • Summer 2007 completion date
Landsat tells Glaciologists about: • Coastal change • Calving • Surface velocity • Elevation • Change in elevation
Ice Measurements with Landsat • Coastal change • Calving • Surface velocity • Elevation • Change in elevation
Elevation? • Ice sheet surface: • Nearly constant albedo • Diffusive reflector • Image brightness becomes a slope map (in direction of solar illumination) • +1 DN = + 8 cm across a 15-m pixel • Slopes used to interpolate elevations between control elevation profiles
100 km Checking Digital Elevation Models with Shaded Relief Images ICESat Digital Elevation Model ICESat elevation precision = +20 cm
ICESat tracks Image-based slopes can provide an accurate interpolation Landsat gives the “right” answer ICESat DEM Landsat-7 30 km 30 km
Elevation range 2003-06 (m) 0 9m MOA (NSIDC) New Science Conway Ridge Mercer Ice Stream (A) Repeat-pass elevation changes are revealing subglacial water movement Whillans Ice Stream (B) Engelhardt Ridge
Image Contributions to New Science of Subglacial Hydrology • Image-derived slopes to adjust elevation to reference track • Repeat tracks are close and parallel, but NOT exact repeats • Spatial (cross-track) elevation differences can be confused with temporal elevation differences • Image differencing to show spatial extent Observed Ground Track Footprint Location: Reference Ground Track:
Adjusted profiles shifted along track Elevation (m) No adjustment Latitude Elevation (m) Latitude 1. Image-based Profile Adjustment Sun 30o reference profile measured profiles
Adjustment to Reference Track Elevation Difference (m)
Image Differences 2. Image Differencing Images Radiometric resolution is critical to success—8-bit data won’t suffice
Conclusions • Landsat data continue to be used in new, innovative ways by glaciologists • The most important LDCM enhancement for ice-sheet research is improved radiometric resolution • 8-bit is inadequate • 12-bit is required