Download
1 / 14
140 likes | 156 Views
Building a Map in PowerPoint. Steps for inserting and building a map. ENVS 221 Lecture 1b Updaged 4/6/2019. How to capture map data. 1. Use the snipping tool to select data from you screen Or 2. Use screen capture and crop your result later, use the Ctrl + Print Screen keys.

E N D
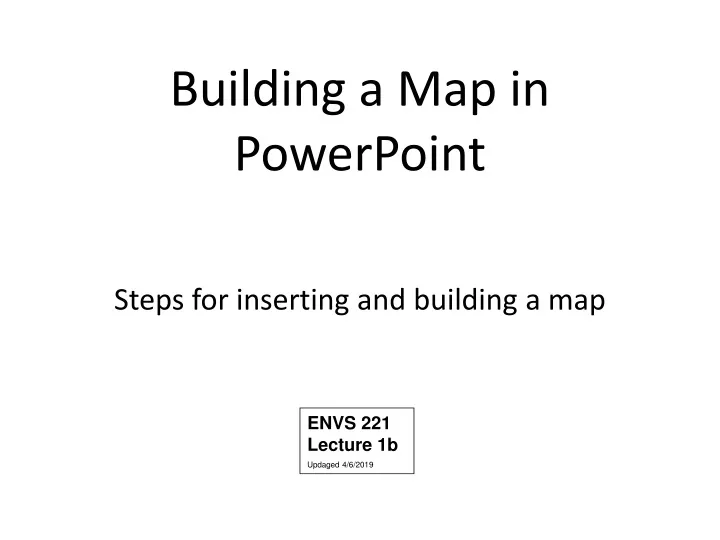
Building a Map in PowerPoint Steps for inserting and building a map ENVS 221Lecture 1b Updaged 4/6/2019
How to capture map data 1. Use the snipping tool to select data from you screen Or 2. Use screen capture and crop your result later, use the Ctrl + Print Screen keys
Desperately Poor in Los Angeles 1990 Note the strong central cluster of the data. Originator: p. buckleyDate: today Source: William Bowen’s Electronic Atlas http://130.166.124.2/chi_1.html
Getting map or picture on slide • Copy map (picture) from web page. • Paste the result onto a blank Powerpoint slide. • Zoom in (Ctrl + scroll on mouse). • Shrink/Expand map to fit Powerpoint slide. • Drag and push map in to fit on slide. • Zoom back out to work. • Begin Cropping off any access material.
Cropping map 1. Make map active by clicking with mouse • Activate Picture Tools • Get cropping tool and crop picture • then after you have cropped things use the compress picture tool.
Adding a Text Box • From Insert click Text Box then click and drag across the screen, adjust to location and size. • Can adjust text and things as desired
Highlighting things on the Map • From Home select shape. • Place and adjust on the map. • Change fill to “no fill”
Adding Neat Lines • For some reason cartographers have always liked to place neat lines around maps and other boxes. (below found under Picture Tools) • Make the picture or box active, choose a neat line from the picture tools and click
Parts to a final Map • Title – Always • Cartographic Material – Always and should dominate the space • Metadata – Always (originator, date, source, contact) keep small • Legend – To extent possible • Compass Rose and/or Locator Map – To extent possible • Scale – To extent possible • Subtitles – As necessary to provide clear explanation
Critiquing the Map • Too much white space • Title could be a bit smaller • Expand cartographic material • If possible add compass rose/locator map • Consider moving the legend onto the cartographic material • Consider shrinking the metadata and making as single line • Can we find a scale? • Make metadata smaller perhaps one line
Note the strong central cluster of the data. Desperately Poor in Los Angeles 1990 Originator: p. buckley, 4/5/2019, Source: William Bowen’s Electronic Atlas http://130.166.124.2/chi_1.htmlemail:patrick.buckley@wwu.edu
Example using Portrait Layout instead of Landscape Email: Patrick.buckley2wwu.edu
Data for our in class work http://depts.washington.edu/labhist/maps-race-seattle.shtml E-Atlas