Download
1 / 30
300 likes | 447 Views
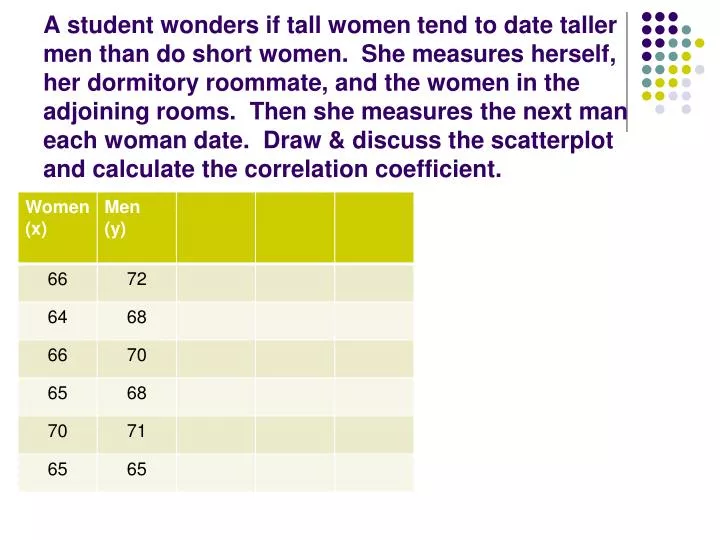
A student wonders if tall women tend to date taller men than do short women. She measures herself, her dormitory roommate, and the women in the adjoining rooms. Then she measures the next man each woman date. Draw & discuss the scatterplot and calculate the correlation coefficient.

E N D
A student wonders if tall women tend to date taller men than do short women. She measures herself, her dormitory roommate, and the women in the adjoining rooms. Then she measures the next man each woman date. Draw & discuss the scatterplot and calculate the correlation coefficient.
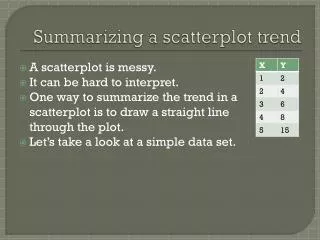
Create scatterplot • Find the correlation • Describe the association
Guess the correlation coefficient • http://istics.net/stat/Correlations/
Regression Line • This is a line that describes how a response variable (y) changes as an explanatory variable (x) changes. • It’s used to predict the value of (y) for a given value of (x). • Unlike correlation, regression requires that we have an explanatory variable.
Let’s try some! • http://illuminations.nctm.org/ActivityDetail.aspx?ID=146
The following data shows the number of miles driven and advertised price for 11 used Honda CR-Vs from the 2002-2006 model years (prices found at www.carmax.com). The scatterplot below shows a strong, negative linear association between number of miles and advertised cost. The correlation is -0.874. The line on the plot is the regression line for predicting advertised price based on number of miles.
The regression line is shown below…. Use it to answer the following. Slope: Y-intercept:
Extrapolation • This refers to using a regression line for prediction far outside the interval of values of the explanatory variable x used to obtain the line. • They are not usually very accurate predictions.
Slope: • Y-int: • Predict weight after 16 wk • Predict weight at 2 years:
The equation of the least-squares regression line for the sprint time and long-jump distance data is predicted long-jump distance = 304.56 – 27.3 (sprint time). Find and interpret the residual for the student who had a sprint time of 8.09 seconds.
Regression • Let’s see how a regression line is calculated.
Let’s standardize the variables The line must contain the point and pass through the origin.
Let’s clarify a little. (Just watch & listen) The equation for a line that passes through the origin can be written with just a slope & no intercept: y = mx. But, we’re using z-scores so our equation should reflect this and thus it’s Many lines with different slope pass through the origin. Which one fits our data the best? That is which slope determines the line that minimizes the sum of the squared residuals.
Line of Best Fit –Least Squares Regression Line It’s the line for which the sum of the squared residuals is smallest. We want to find the mean squared residual. Residual = Observed - Predicted Focus on the vertical deviations from the line.
Let’s find it. (just watch & soak it in) St. Dev of z scores is 1 so variance is 1 also. This is r!
Continue…… Since this is a parabola – it reaches it’s minimum at This gives us Hence – the slope of the best fit line for z-scores is the correlation coefficient → r.
Slope – rise over run A slope of r for z-scores means that for every increase of 1 standard deviation in , there is an increase of r standard deviations in . “Over 1 and up r” Translate back to x & y values – “over one standard deviation in x, up r standard deviations in y. Slope of the regression line is:
Why is correlation “r” • Because it was calculated from the regression of y on x after standardizing the variables – just like we have just done – thus he used r to stand for (standardized) regression.
The number of miles (in thousands) for the 11 used Hondas have a mean of 50.5 and a standard deviation of 19.3. The asking prices had a mean of $14,425 and a standard deviation of $1,899. The correlation for these variables is r = -0.874. Find the equation of the least-squares regression line and explain what change in price we would expect for each additional 19.3 thousand miles.
So let’s write the equation! Slope: Explain the slope:
Now for the final part – the equation! Y-intercept: Remember – it has to pass through the point . Solve for y-intercept:
Now it can be used to predict. • How many calories do I expect to find in a hamburger that has 25 grams of fat?