Download
1 / 41
410 likes | 578 Views
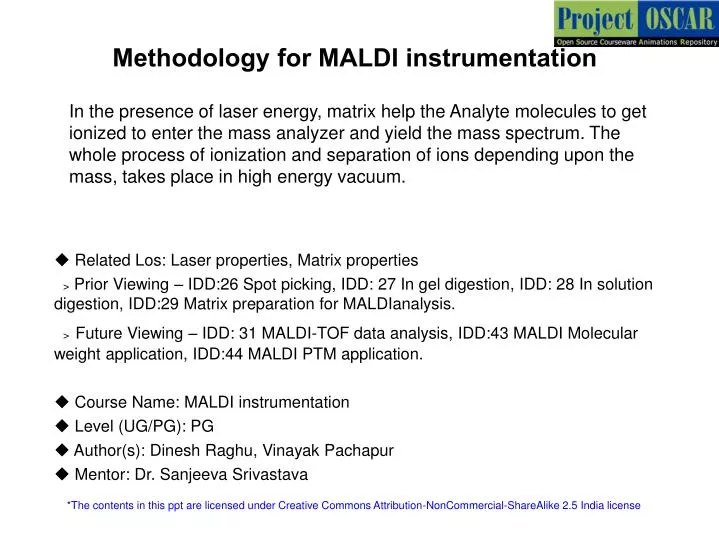
Methodology for MALDI instrumentation. In the presence of laser energy, matrix help the Analyte molecules to get ionized to enter the mass analyzer and yield the mass spectrum. The whole process of ionization and separation of ions depending upon the mass, takes place in high energy vacuum.

E N D
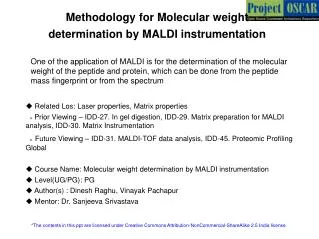
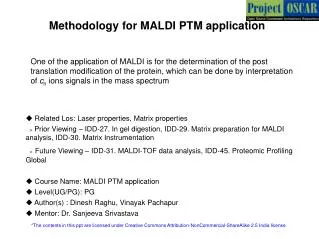
Methodology for MALDI instrumentation In the presence of laser energy, matrix help the Analyte molecules to get ionized to enter the mass analyzer and yield the mass spectrum. The whole process of ionization and separation of ions depending upon the mass, takes place in high energy vacuum. • Related Los: Laser properties, Matrix properties • > Prior Viewing – IDD:26 Spot picking, IDD: 27 In gel digestion, IDD: 28 In solution digestion, IDD:29 Matrix preparation for MALDIanalysis. • >Future Viewing – IDD: 31 MALDI-TOF data analysis, IDD:43 MALDI Molecular weight application, IDD:44 MALDI PTM application. • Course Name: MALDI instrumentation • Level (UG/PG): PG • Author(s):Dinesh Raghu, Vinayak Pachapur • Mentor: Dr. Sanjeeva Srivastava *The contents in this ppt are licensed under Creative Commons Attribution-NonCommercial-ShareAlike 2.5 India license
5 3 2 4 1 Learning objectives After interacting with this learning object, the learner will be able to: Operate the MALDI instrumentation Analyze the mechanism behind the MALDI-MS analysis Infer the MALDI analysis software Assess the troubleshooting steps involved in the experiments.
5 3 2 4 1 Master Layout Sample loading (Slide: 8-12) Parameters setting (Slide: 13-18) Firing spots (Slide: 19-24) Storing Data (Slide: 25) PMF data from CID (Slide: 26-28) Master layout for Instrumentation of MALDI
5 3 2 4 1 Master Layout Master layout for Mechanism of MALDI Sample Firing (Slide: 29-30) Linear mode (Slide: 31) Reflector mode (Slide: 32-33) Time of flight equation (Slide: 34)
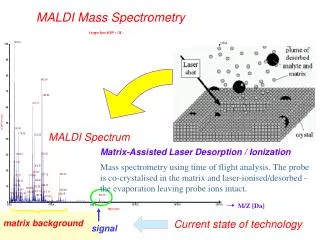
5 3 2 4 1 Definitions and Keywords 1. Mass Spectrometry (MS): is a analytical technique used to measure intrinsic property of a bio-molecule, its mass, with very high dynamic sensitivity. 2. Matrix Assisted Laser Desorption Ionization (MALDI): MALDI is effective ionization system for generating gas-phase ions of proteins and peptides for mass spectrometric detection.The analyte of interest is embedded in dried matrix-sample is exposed to pulses from a UV laser for further separation and detection. 3. Ionizer: One of the major components of MS instrumentation which fragments the sample into an ionic form to help for further detection. MALDI and ESI are most commonly used ionizer for proteins samples. 4. Electrospray Ionization (ESI):Analyte in liquid form is pumped at very low flow rate through a needle at high voltage to electrospray droplets, which evaporate at faster rate to impart their charge onto the analyte molecule. 5. Ionization source Laser: Light amplification by stimulated emission of radiation (LASER or laser) is a mechanism for emitting electromagnetic radiation. 6. Mass analyzer:The mass analyzer resolves the ions produced based after ionization on basis of mass-to-charge ratios. Various characteristics such as resolving power, accuracy, mass range and speed determine the efficiency of these analyzers. Commonly used mass analyzers include Time of Flight (TOF), Quadrupole (Q) and ion trap.
5 3 2 4 1 Definitions and Keywords 7. Time-of-Flight (TOF):This is a mass analyzer in which the flight time of the ion from the source to the detector is correlated to the m/z of ion. 8. Flight tube: Connecting tube between the ion source and detector within which the ions of different size and charge migrate to reach the detector. 9. Reflectron: The reflectron acts as an ion mirror, and extends the flight length without increasing the instrument size. The reflectron compensates for the initial energy spread of ions having the same mass. 10. Reflectron detector: Detects the ions reflected by ion mirror. This over all setup improves the resolution. 11. Detector:The ion detector determines the mass of ions that are resolved by the mass analyzer and generates data which is then analyzed. The electron multiplier is the most commonly used detection technique. 12. PMF: Peptide Mass fingerprint, is nothing but the collection of data in the mass by charge ratio plotted along the X-axis and its intensity on Y-axis. 13. CID: Collision induced dissociation, the accelerate ions are made to collide with natural gas like nitrogen and helium, to fragment the ion into its precursor/daughter ions.
5 2 1 4 3 Audio Narration (if any) Description of the action/ interactivity Step 1: Initial slide “Click for MALDI Mechanism” “Click for MALDI Instrumentation” MALDI Button:1 Button:2 When selects the MALDI IDD. Animate the initial slide like above. Instruct user with the pop-note. When user selects ‘Button:1’ take user through slides from: 29-35. When user selects ‘Button:2’ take user through slides from: 8-28. Note: Animate the pop-up note for instructions like shown above in other slides also.
5 2 1 4 3 Audio Narration (if any) “make the MALDI plate ready with sample and matrix prep” “click launchpad icon” “click on Kompact icon”. Description of the action/ interactivity Step 1: T1:Sample loading Take the user through the slides of IDD: matrix-sample preparation. Instruct user to make the MALDI plate ready with sample and matrix prep. Instruct user with pop-up note to “click launchpad icon” from the desktop, animate to show the launchpad window like above. Now instruct user with pop-up note to “click on Kompact icon”. Note: Animate the pop-up note like shown above in other slides also. Once the MALDI plate is spotted with the matrix-sample solution, and dried up nicely, it can be taken for the analysis. The plate loading into the system is controlled by launchpad software.
5 2 1 4 3 Audio Narration (if any) Description of the action/ interactivity Step 1: T1:Sample loading Let user have control over the icons on the toolbars. Instruct user with pop-up note to click on “Instrument”, animate a drop down menu for user to select ‘instrument status’. Now animate an Instrument Status window with the options as shown in the figure must be displayed. Animate a pop-up note for “open Acquisition mode”. Let user click on Instrument, in the drop down menu, provide Acquistion option for user to select. Display the Acquisition window as shown. Before operating the instrument, the plate must be loaded, by giving command over acquisition node. Now user must check the instrument status before inserting the plate.
5 2 1 4 3 Audio Narration (if any) Description of the action/ interactivity Step 1: T1:Sample loading Instruct user with a pop-up note to “check the pressure in gauge:1”. Animate to display the pressure around 2.3e-5 torr. Display pop-up note “pressure is fine”. Now instruct user with pop-up note to “Load the plate”. Animate for Exp.tech display in Acquisition mode. Instruct user with pop-up note to “click on Exp.Tech” followed by “click on OPEN Door”. If the pressure is high, the vents in the chamber get jam to prevent the door opening. If it is high wait for few minutes, for the pressure to come down.
5 2 1 4 3 Audio Narration (if any) Description of the action/ interactivity Step 1: T1:Sample loading After click on “OPEN Door” command. Display the instrument, animate a small metal door opening out, a plane surface platform comes out. Instruct user with pop-up note to “place the plate on the surface”. Animate user following the instruction to place the plate on the surface. Now instruct user with pop-up note to click on “CLOSE DOOR” option. Animate the surface moving into the instrument and door getting closed. Once the door opens, place the plate in the groves provided. The plate will be placed on the surface only in one direction. Note the plate number such as(96x4700+00-de1487ta.plt) and position of spotted sample.
5 2 1 4 3 Audio Narration (if any) Description of the action/ interactivity Step 1: T1:Sample loading Instruct user with pop-up note to “load the plate parameters”. instruct user click on “SLIDE” on Acquisition window. Now let user click on LOAD, animate a ‘Open’ window. Let user select the file in which the last 6 digits/characters match the model number on the plate (noted down from previous slide). Instruct user with pop-up note to “Click on Open” to load the parameters and “click on Apply”. Once the plate is loaded inside the instrument, the plate parameter need to be specified. Select the file to be loaded which matches the plate number. The plate parameters are loaded onto current software session.
5 2 1 4 3 Audio Narration (if any) Description of the action/ interactivity Step 2: T2:Parameter setting Instruct user with pop-up note to “set the experimental parameters”. Let user check the gauge:1 pressure. Now in Exp.Tech display the options as shown in figure. Instruct user with pop-up note to “select Tunning mode: linear”, “feeds in Mass range: 1 to 106”(default value), max laser rep.rate: 10 (default value). Once the parameters are set by user, instruct user with pop-up note to “Click on Operate”. Now animate a line on the instrument status and also display it to turn orange. For experimental parameters, in the begining Linear or reflector mode is selected. In reflector mode the sensitivity is more and better. For mass range is default value or user can define it, if user know the mass range of analyte. In Max. Laser Rep. rate it is set for 10. now the system is ready for operation.
5 2 1 4 3 Audio Narration (if any) Description of the action/ interactivity Step 2: T2:Parameter setting Display the turbo:1, turbo:2 and Laser box in green color, and animate gauage:1 presssure as 1.5e-5 torr, Vacuum state: operate, tunning mode: linear, instrument mode: linear. Now instruct user with pop-up note to “start firing the spot for data collection”. The instrument is in operate mode, if boxes show up green color and gauage:1 pressure is around 1.5e-5 torr. If the pressure is not attained wait for it to attain and proceed further for firing and data collection.
5 2 1 4 3 Audio Narration (if any) Description of the action/ interactivity Step 2: T2:Parameter setting Instruct user with pop-up note to “set the parameters for Data collection”. Instruct user to select “Firing” option in the Acquisition window. Animate user control for the parameters shown in the firing window. For data collection the firing parameters need to be set. For some parameters the default works, in some case user can set the parameters depending on the need. First select the spot which need to be fired.
5 2 1 4 3 Audio Narration (if any) Description of the action/ interactivity Step 2: T2:Parameter setting Instruct user with pop-up note to “select the target spot for laser to align”. Right-click anywhere in yellow area, animate to provide a small window for “go to location” option. Instruct user to feed in value say “A1” and “click on OK”. Animate movement in camera view, getting focused on a round spot. Initially user needs to align the laser with the target spot before setting other parameters. This is done to be on safer side, in any case if user clicks on fire button, the laser must hit the sample spot not the metal plate.
5 2 1 4 3 Audio Narration (if any) Description of the action/ interactivity Step 2: T2:Parameter setting 5 buttons Instruct user with pop-up note for “fine adjustment to click on these 5 buttons”. Let user click these 5 buttons to shift the laser in the direction of the arrow with camera movement for fine adjustment during firing. For raster movement of laser over the spot, user can select the icon with arrows . To undo the raster selection, user can click on HOLD button. To undo manual selection, cancel out the yellow button. Do fine adjustment for small fine alignment, and to find the sweet region within the spot.
5 2 1 4 3 Audio Narration (if any) Description of the action/ interactivity Step 2: T2:Parameter setting The parameters need to set by user are default. User need to fine tune the parameters setting to get sweet spot for better data. If the parameters are optimum, user can save it and reload the same parameters for future use. Instruct user with pop-up note to “set power and other parameters”. Animate the options with input values by user control over the parameters setting. Animate the range for Power:1-200: default=85 along with cursor selection on scale with increase and decrease, range for profiles=1-500: default=100, range for Shots=1-10:default=2, options for Ion gate: OFF (default), range to optimize for:1000-3000. Instruct user with pop-up note to “save the parameters setting" followed by “FILE>Parameters>Save.
5 2 1 4 3 Audio Narration (if any) Description of the action/ interactivity Step 3: T3:Firing of spots Instruct user with pop-up note to click “FIRE” button. Animate peak appearing in the main kompact window. Instruct user with pop-up note to “make fine adjustment, so as to obtain more intense peaks”. animate user control click on the 5 buttons and then click adjustment must be synchronize with camera view movement. When all the parameters are set, the system is ready to fire the laser and collect the data. Initially fire the standard mix spot.
5 2 1 4 3 Audio Narration (if any) Description of the action/ interactivity Step 3: T3:Firing of spots a single profile peak accumulated profiles In the main window, animate for each laser shot, a single profile peak coming in top position followed by accumulation of all the profiles in below position. Instruct user with pop-up note to “zoom-in/zoom-out the spectrum”. Animate to provide user control for the option to view the peak in zoom-in/zoom-out mode by dragging the mouse on the peak. The graph need to be plotted with respect to mass/charge to % intensity. Top view is a single profile peak and bottom is accumulated profiles. The accumulated profiles are also called PM (Peptide Mass) data.
5 2 1 4 3 Audio Narration (if any) Description of the action/ interactivity Step 3: T3:Firing of spots After collecting the peaks for standard mix. Instruct user with pop-up note to “calibrate the instrument”, click “Processing” followed by selecting “Calibration” in drop down menu. Calibration window must appear for user control. Instruct user with pop-up note to “select out the standard peaks from list reference”. Instruct user with pop-up note to set the tolerance value followed by click on “Calibrate”. Once the instrument is calibrated, load the file and save it by file name with user input. The standard peaks help to calibrate the instrument. Calibrate the system by providing least tolerance value. After calibration the system is ready for firing the targets.
5 2 1 4 3 Audio Narration (if any) Description of the action/ interactivity Step 3: T3:Firing of spots User must play around the spot region to find sweet spot, where the peaks are more in number with high intensity. After several profiles user can save the data. Instruct user with pop-up note to “select the actual target spot”, by right-click on yellow region, and specifying the target spot and click on “Fire” button. Animate initially low peaks, now let user make fine adjustments with 5 buttons, make movement in camera view also, now display more peaks with high intensity. Let user keep playing around to complete 100 profiles. Now highlight Store button for click, after user clicks, let user have option to save the data in a save option window.
5 2 1 4 3 Audio Narration (if any) Description of the action/ interactivity Step 3: T3:Firing of spots Now user can select some other spot and start firing like in previous slide. In between firing, if user likes to pause, user have an option like Abort, Resume. In case the peaks obtained are not fine, user can click on “abort” and click on “clear data” to clear all the data collected to re-start again. In between firing user have option for abort, resume, suspend and clear data. User can select these options depending on the profile data obtained.
5 2 1 4 3 Audio Narration (if any) Description of the action/ interactivity Step 3: T3:Firing of spots In most cases the default parameters for peak processing are best suited. If user is not okay with the data collected, user can make peak processing with the required settings. Instruct user with pop-up note to ‘carry out peak processing’, “select Processing> peak processing”. Display peak processing window with user controls. Let user have option for method selection, baseline subtraction, threshold, average display of profiles.
5 2 1 4 3 Audio Narration (if any) Description of the action/ interactivity Step 4: T4:Data Storage After peak processing, Instruct user with pop-up note to save the data to be exported”. Instruct user with pop-up note to select “File>Export>ASCII”. A small window display for user control must pop up. Let the user selects the default values and click on Save as.. to open the Save As window. Browse to user desired location, enter a File name, and click ‘Save’. The PMF data will be saved. Once the PMF data is ready, data in the excel format can be exported, and saved. The peptide spectrum can be saved directly as ASCII files
5 2 1 4 3 Audio Narration (if any) Description of the action/ interactivity Step 4: T5:PMF data by CID Display the above figure and Instruct user with pop-up note to “carry out CID analysis”. Instruct user with pop-up note to “select any of the peak” from the figure and do a CID analysis for the same. CID is done for the high intense peak from the spectrum. Now each of these peaks will produce the precursor ions which will lead to more PMF data for the identification of the protein.
5 2 1 4 3 Audio Narration (if any) Description of the action/ interactivity Step 5: T5:PMF data by CID Instruct user with pop-up note to “click on Ion gate option” click for “ON”. Let user set the range for the selected peak. For peak1 selection, let user set the ion gate value from 900-1100, and follow the same firing step like in previous slide. In between firing user have option for abort, resume, suspend and clear data. User can select these options depending on the profile data obtained.
5 2 1 4 3 Audio Narration (if any) Description of the action/ interactivity Step 4: T5:PMF data by CID Display the above figure. Similarly animate getting the PMF data for other two peaks. In CID the peptide of our interest is further broken down to precursor/daughter ions. The PMF data of each peak can later be combined together to perform a MASCOT search. More the PMF data better will be the match in database for the identification.
5 2 1 4 3 Audio Narration (if any) Description of the action/ interactivity Step 4: T6:Mechanism of MALDI (Sample firing) Once the data is collected for all the spots. Instruct user to change the system mode. Instruct user with pop-up note on “Standby” mode and click on Open door, let user take out the plate, now let user click on “close Door. Animate the opening and closing of the door and change the status of Vaccum state as: standby no red line in the instrument status. Soon after firing all the spots and saving the data. User need to change the mode of the system to standby. If the user is not firing the spots the system must always be in standby mode.
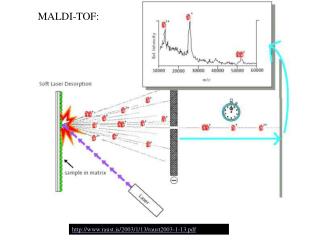
5 2 1 4 3 Audio Narration (if any) Description of the action/ interactivity Step 6: T6:Mechanism of MALDI (Sample firing) The target plate containing the spotted matrix and analyte is placed in a vacuum chamber with high voltage and short laser pulses are applied. The laser energy gets absorbed by the matrix and is transferred to the analyte molecules which undergo rapid sublimation resulting in gas phase ions and starts moving in field region to get separated depending upon the mass. Please re-draw the figure. show matrix in small green circles, sample analyte in large violet circles on the plate. Now animate laser source hitting the plate surface, matrix and samples molecules must start flying, and proceed to the TOF column for separation.
5 2 1 4 3 Audio Narration (if any) Description of the action/ interactivity Step 6: T6:Mechanism of MALDI (linear mode) The time-of-flight analyzer resolves ions produced by the ionization source on the basis of their mass-to-charge ratio. The TOF tube can be operated in the linear mode for small molecules, this mode usually provides sufficient resolution. The generated ions are accelerated towards the detector with the lighter ions traveling through the TOF tube faster than the heavier ions. The flight time of the ions is correlated with the m/z ratio. First show the rectangular tube with the ‘detector’ on the right end & the ‘ion source’ on the left end. Next, show the appearance of the colored circles which must then move towards the ‘detector’ such that the smallest circle moves the fastest & the largest one moves slowly.
5 2 1 4 3 Audio Narration (if any) Description of the action/ interactivity Step 6: T6:Mechanism of MALDI (Reflector mode) The TOF analyzer can also be operated in the reflectron mode, which is more commonly used for proteomics studies. A reflectron, which acts as an ion mirror, is incorporated at one end of the TOF tube. This helps in extending the path length and in turn the flight time of the ion without having to increase the actual size of the instrument. This helps to even out any kinetic energy differences between ions having the same mass and thereby improves the resolution. First show the rectangular tube with the ‘reflectron’, ‘detector’ & the ‘ion source’ on the right, middle and left end. Next, show the appearance of the colored circles which must then move towards the ‘reflectron’ where they get deflected and ultimately reach the ‘reflectron detector’. The smallest circle must move faster with more reflection, while the largest must move slowly with less reflection as shown in the animation.
5 2 1 4 3 Audio Narration (if any) Description of the action/ interactivity Step 6: T6:Mechanism of MALDI (Reflector mode) The collision induced dissociation (CID), helps in further breakdown of the parent ion into its precursor ions. The precursor ion than follow the reflectron depending upon the time travelled to the detector is noted down for calculating the Mass. First show the rectangular tube with the ‘reflectron’, ‘detector’ & the ‘ion source’ on the right, middle and left end. Next, show the appearance of the colored circles which must then move towards ion gate, show only 1cirlce passing the ion gate, getting fragmented into small ion in CID cell and than moving along the reflectron-TOF. The smallest circle must move faster with more reflection, while the largest must move slowly with less reflection as shown in the animation.
5 2 1 4 3 Audio Narration (if any) Description of the action/ interactivity Step 6: T6:Mechanism of MALDI (Time of flight equation) Where t = time-of-flight (s) m = mass of the ion (kg) q = charge on ion (C) V0 = accelerating potential (V) L = length of flight tube (m) 1/2 m L t = 2qV0 Show appearance of the equation and meaning of each of its variable as user clicks on it. The time of flight of an ion can be calculated by means of the equation shown. The Time of flight is directly proportional to the square root of mass of the ion, rest other parameters are kept constant. Therefore, depending upon the time taken to reach the detector, the mass can be calculated. For continuation please follow future viewing IDD mentioned in slide:1
Animation area In slide-12: let user carry out firing without checking the pressure attained. Instruct: user to wait till the desired pressure is attained and proceed accordingly. In slide-31: in case user is getting low intensity peak, ask for the user input Instruct: user to increase the collision energy to enhance peak intensity. In slide-31: if user is facing problem with precursor ion overlap Instruct: user to tighter precursor selection tolerance for MS/MS. Button 03 Button 02 Button 01 Credits Instructions/ Working area Slide 8-12 Slide 1-5 Slide 13-18 Slide 19-24 Slide 26-28 Slide 25 Slide 29-30 Introduction Tab 05 Tab 06 Tab 04 Tab 03 Tab 02 Tab 01 Name of the section/stage Interactivity area
Button 01 Button 02 Button 03 Credits Instructions/ Working area Slide 13-34 Slide 31 Slide 32-33 Tab 07 Tab 08 Tab 09 Name of the section/stage Interactivity area
APPENDIX 1 Questionnaire: Question 1 The laser will not operate unless the pressure in the chamber is? a) 1.5e-5 torr b) 2.5e-5 torr c) 3.5e-5 torr d) 4.5e-5 torr Answer : a) 1.5e-5 tor Question 2 In time of flight, analytes are separated depending upon? • Distance travelled • Velocity of alalyte • Mass • Non of above • Answer:c) Mass
APPENDIX 1 Questionnaire: Question 3 For higher molecular weight proteins, separation is best in? • Reflectron mode • Linear mode • Acquisition mode • Laser mode • Answer : a) Reflectron mode Question 4 Which of the following is not a mass analyzer? a) Time-of-Flight (TOF) b) Quadrupole (Q) c) Ion traps d) MALDI Answer: d) MALDI
APPENDIX 1 Questionnaire: Question 5 The wavelength of laser used for ionization? a) 337nm b) 437nm c) 537nm d) 637nm Answer: a) 337nm 6. Question 5 MALDI is a a) Soft ionization technique b) Hard ionization technique c) Both of them d) None of them Answer a) Soft ionization technique
APPENDIX 2 • Links for further reading • Papers: • 1.Hillenkamp F, Karas M, Beavis RC, Chait BT. Matrix-assisted laser desorption/ionization mass spectrometry of biopolymers. Anal Chem. 1991, 63, 1193A-1203A. • 2. Karas M, Glückmann M, Schäfer J. Ionization in matrix-assisted laser desorption/ionization: singly charged molecular ions are the lucky survivors. J Mass Spectrom. 2000, 35, 1-12. • 3. Hillenkamp F, Karas M. Mass spectrometry of peptides and proteins by matrix-assisted ultraviolet laser desorption/ionization. Methods Enzymol. 1990, 193, 280-295. • 4. KERSTIN S TRUPAT, Molecular Weight Determination of Peptides and • Proteins by ESI and MALDI, METHODS IN ENZYMOLOGY,2005, VOL. 405. • Books: • Proteomics: A cold spring harbor laboratory course manual by Andrew J L and Joshua L, 2009.
APPENDIX 3 Summary MALDI-MS is very useful technique used for proteomic applications. The optimized parameters and variable settings help to obtain the best mass spectrum. Advanced progress in instrumentation with additional applications continues to be made at a rapid pace.