Download

1 / 31
320 likes | 715 Views
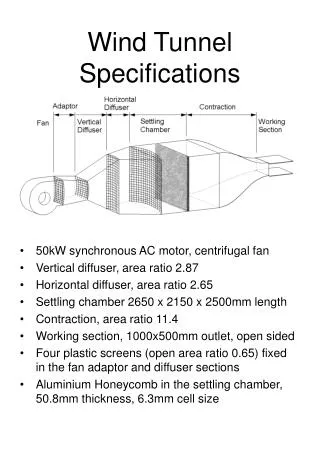
Wind Tunnel Experiments for Grades 8 - 12. Dr. Judy Foss Van Zante Dynacs Engineering Co., Inc. Cleveland, OH. 6/15/99. Contents. Sample Experiments 3 Governing Equations 15 Flow Visualization Techniques 19 How to Make the Measurements 24

E N D
Wind Tunnel ExperimentsforGrades 8 - 12 Dr. Judy Foss Van Zante Dynacs Engineering Co., Inc. Cleveland, OH 6/15/99
Contents Sample Experiments 3 Governing Equations 15 Flow Visualization Techniques 19 How to Make the Measurements 24 Background - Why Test in Wind Tunnels 27 Selected References 31
Ideas for Wind Tunnel ExperimentsModel: Airfoil or Flat Plate L vs. a Lift vs. Angle of Attack L vs. V Lift vs. Velocity CD vs. Re Drag vs. Reynolds Number i.e., vary Speed and/or Size Investigate the effects of contamination on the leading edge (sand paper, paper mache) to mimic ice accretion, bug splat, etc... This should reduce max lift & increase drag.
Flow Wind Tunnel Test Section with AirfoilMounting Options Airfoil on Sting Wall-Mounted
a a Lift vs. Angle of Attack As the angle of attack increases, so should the lift - until a certain point (the stall angle of attack). Angle of attack (a): angle between flow and chord line. Chord line: straight line between most forward and most aft points Lift Flow
scale Lift vs. Angle (cont.) Lift Angle Visual: See airfoil lift as angle increases Measure: airfoil lift as a function of angle
Lift vs. Velocity As the velocity (speed) increases, so should the lift. Note: Keep the angle of attack constant. The greater the angle (prior to stall) the greater the change in lift. Lift Velocity (Speed)
L Lift V2 Velocity scale Lift vs. (Velocity)2 Visual: See airfoil lift as speed increases Measure: airfoil lift as a function of speed
Ideas for Wind Tunnel ExperimentsModel: Drag Body Double Elimination Competitions Build two objects. In a head-to-head comparison, see which one has the least drag. Which way will the object with the most drag move? Race Cars Geometric shapes
Wind Tunnel with Drag ObjectsMounting Options Bluff Bodies Race Cars Rotating Sting Pulley
Ideas for Wind Tunnel ExperimentModel - Drag Body Notes: The frontal area (the side facing the flow) must be the same. Drag is directly related to the surface area. If using the pivot & sting, objects must be mounted equally far apart from the pivot point. It is important that each object has the same moment arm. If using the pulley system, it might be better to have two pulleys.
Governing Equations Lift & Drag are equal to the Dynamic Pressure * Surface Area * Coefficient These Coefficients are a function of Angle of Attack, Model Geometry & Mach number
Nomenclature Dynamic Pressure, ½ r V2 r = density (of air); “rho” V = velocity (speed) Surface Area, S S = chord * span chord is wing length,span is wing width Coefficient of Lift CL = function (a, model, Ma) Coefficient of Drag CD = function (a, model, Ma)
Governing EquationNotes The Lift and Drag can be changed most easily by changing the angle of attack (a) or speed (V). Of course, the surface area (S) can also be adjusted. If a water tunnel is also available, the working fluid (r), e.g. air to water, can also be a variable. During the course of one experiment, it is important to only change one variable at a time.
Flow Visualization Techniques Flow Visualizationillustrates the flow on or near the object. On the surface, regions of reverse flow become visible. Yarn Tufts, Tuft Probe, Tuft Grid Smoke Wand, Smoke Wire Trailing Edge Cone (String & paper cone)
Flow Visualization TechniquesYarn Yarn Tufts - tape ~1” segments of yarn directly to the surface. Tuft Probe - tape ~3” light-weight (and visible) string to end of rod. Probe the flow. Tuft Grid - attach ~1” segments of yarn to a wire mesh (screen) and place behind object (perpendicular orientation to the flow) Trailing Edge Cone - tape one end of string to paper cone, and the other end to (spanwise) edge of model. This illustrates streamwise vorticity, if present. It’s great for delta wings.
x x x x x x x x x x x x x x x x x x x x Tuft Grid Flow Visualization TechniquesIllustrated Yarn Tufts on surface Tuft Probe Delta Wing Trailing Edge Cone
Flow Visualization TechniquesCautions For yarn & string: If the inertia (mass) of the yarn/string is too large, it won’t “follow” the flow. For smoke: If the airspeed is too high, the smoke and air will mix and “blur”.
Wind Tunnel Experiment Details Measuring Lift For airfoil and sting:measured from the scale (ounces). Wt0 = weight at zero velocity. L = Wt0 – Wt Caution: try to minimize the friction (binding) at the tunnel/sting interface, e.g., with a brass bearing. For wall mounted: measured from a load cell. Caution: this is a non-trivial pursuit.
Wind Tunnel Experiment Details Measuring Velocity Pitot-static tube DP = Ptotal - Pstatic Bernoulli’s Equation: DP = (1/2)rV2, r 1 kg/m3 (units!) V = 2* DP/r Three-cup anemometer
Why Test in Wind Tunnels? The Ultimate Goal: to Understand the Fluid Mechanics or Aerodynamics of an • Aircraft in Flight • Submarine in Water • Automobile on Road • New Structure (Building, Bridge) in City How do you get There from Here? • Build a model and test it • In a Wind Tunnel • On a Computer
Two of NASA’s Wind Tunnels Langley Ames 80’ x 120’
Types of Wind Tunnels Full Scale / Full Geometry (1999 price estimates) • NASA Glenn 10’ x 10’ Supersonic $2000/hr • NASA Ames 80’ x 120’ $1000/hr Sub-Scale / Single Component • NASA Glenn 20” x 30” Low Speed $2/hr How does one scale a model? • Geometric • Dynamic (e.g. Reynolds Number, Re = rUL/m)
Selected References Aerodynamics • Abbott, Ira A. & von Doenhoff, Albert E., “Theory of Wing Sections,” Dover Publications, 1959. • Anderson, John D., “Fundamentals of Aerodynamics,” McGraw-Hill, Inc., 2nd Ed., 1991. • Anderson, John D., “Introduction to Flight,” McGraw-Hill, Inc., 3rd Ed., 1989. • Shevell, Richard S., “Fundamentals of Flight,” Prentice-Hall, Inc., Englewood Cliffs, NJ, 1983. Fluid Mechanics 5. Potter, Merle C. & Foss, John F., “Fluid Mechanics,” The Ronald Press Co., NY, 1975 (now published by Great Lakes Press). • White, Frank M., “Fluid Mechanics,” McGraw-Hill Inc., 2nd Ed., 1986. • Shapiro, Ascher H., “Shape and Flow: The Fluid Dynamics of Drag,” Science Study Series, Anchor Books, Doubleday & Co., Inc.,Garden City, NY, 1961. Flow Visualization 8. Van Dyke, Milton, “An Album of Fluid Motion,” Parabolic Press, P.O. Box 3032, Stanford, CA 94305-0030, 1982. 9. Japan Society of Mechanical Engineers, “Visualized Flow,” Pergamon Press, 1988. 10. National Committee for Fluid Mechanics Films, “Illustrated Experiments in Fluid Mechanics,” The MIT Press, Cambridge, MA and London, England, 1972.