Download
1 / 27
280 likes | 364 Views
Managing Economic and Demographic Information for Modelling. DEPARTMENT OF WATER AFFAIRS AND FORESTRY User Group Forum 1 July, 2004. Brendon Wolff-Piggott Independent Specialist Consultant. Structure. 1. Background 2. Opportunities 3. Current and envisaged systems

E N D
Managing Economic and Demographic Information for Modelling DEPARTMENT OF WATER AFFAIRS AND FORESTRYUser Group Forum1 July, 2004 Brendon Wolff-Piggott Independent Specialist Consultant
Structure 1. Background 2. Opportunities 3. Current and envisaged systems - Baseline information management - Managing future estimates 4. Summary
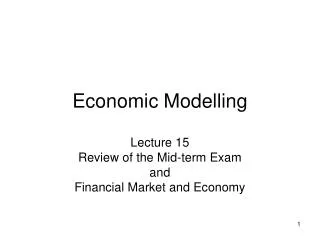
Raw Data External Data Information Management in DWAF Management Decision-making Information Warehouse D: WRPS CD: IM Processed Information Systems Source Information Systems Source Information Processed Information
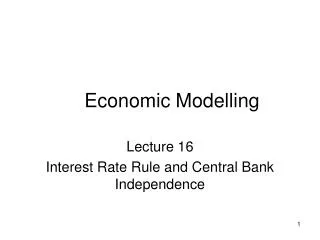
Typical water resource system Runoff Minordams Irrigation SFRAs Groundwater Reservoir Urban Rural Ecology Industrial
Study Identifies Additional Information Runoff Minordams Irrigation SFRAs Groundwater Reservoir Urban Rural Ecology Industrial
Opportunities • Baseline data sets exist e.g. Census • Planning estimates of long-term economic and demographic scenarios related to water use have been made • Detailed studies can provide additional info • Water Services estimates current population using the Census • Useful for national and catchment strategy modelling and planning
Issues to address • Information collected for different purposes • Often not easy to build on • Different boundaries • Boundaries changes over time • Assumptions not stated • Relationship to catchments not in data
Matching Different Information Planning Estimates Water Services Info Census ?
Proposed System Capabilities:Population and Socio-economic IMS • Based on Census 2001 • All data sets should be represented as adjustments to the Census • Metadata tracked for each data set • Adjusted Census data aggregated as needed • Visual displays important for comparison of data
Managing future estimates • Review needed of Planning Estimates against Census 2001 • Next census due in 2011 • Sample surveys, expert workshops and other methods should be identified • Communication with other Directorates and Departments should be supported
Demographic and Economic Indicators 2025 2015 2005 1995 Planning Estimates
Proposed System Capabilities:Population Projection IMS • Draws baseline population and socio-economics from PesIMS • Baseline population distributions “grown” to match estimated future totals (e.g. ASSA 2002 provincial results) • Future distributions then revised based on factors such as estimated future GGP, transportation network density etc. • “Scenario manager” to track all inputs to develop a future projection, and supports sensitivity analysis • Visual displays important • Results stored in PesIMS
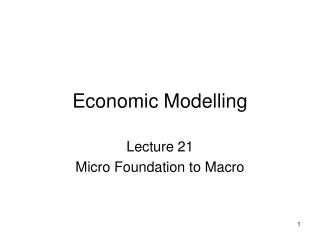
Low Scenario High Scenario Linear Projection 65000000 60000000 55000000 Population 50000000 45000000 1995 2000 2005 2010 2015 2020 2025 Year Example Output 1National Scenarios of Population Growth (HIV/AIDS impact) 40000000
Summary • Several country-wide data sets exist • Establishment of IMSs would provide common basis for modelling/planning • Results from more detailed studies could be incorporated • Two systems are envisaged to support modelling dynamically • Potential for greatly improved communication and information management