Download
1 / 26
260 likes | 358 Views
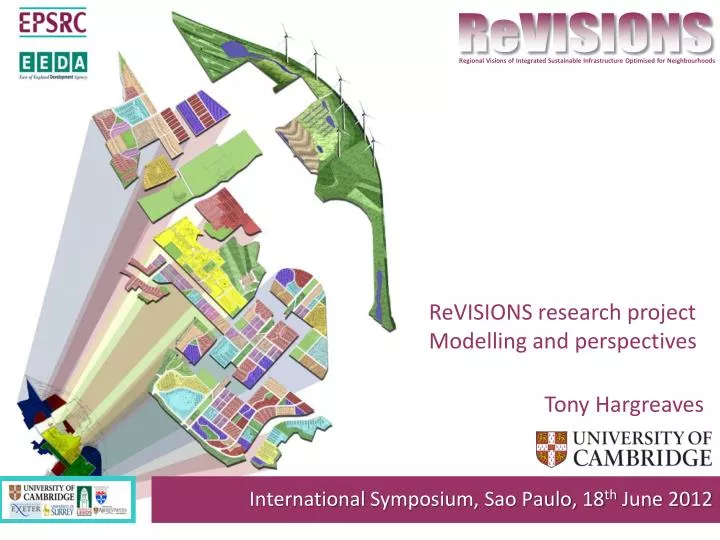
ReVISIONS. Regional Visions of Integrated Sustainable Infrastructure Optimised for Neighbourhoods. ReVISIONS research project Modelling and perspectives Tony Hargreaves. International Symposium, Sao Paulo, 18 th June 2012. ReVISIONS. Overview: Method.

E N D
ReVISIONS Regional Visions of Integrated Sustainable Infrastructure Optimised for Neighbourhoods ReVISIONS research project Modelling and perspectives Tony Hargreaves International Symposium, Sao Paulo, 18th June 2012
ReVISIONS Overview: Method Regional Visions of Integrated Sustainable Infrastructure Optimised for Neighbourhoods REGIONAL CASE STUDIES SYSTEMATIC OPTION DESIGN Strategic Trend Compaction Dispersal Expansion Local Economies of scale Decentralised services Retrofit & new build ASSESSMENT (Indicators) Economic (Net benefit & feasibility) Social Equity (Distribution) Environmental (Protection) Resources (use) ANALYTICAL TOOLS Integrated quantitative Modelling framework (Forecasting) Stakeholders/Researchers GUIDANCE
Overall Integrated Modelling Framework Spatial Planning Policy option Spatial demand per activity Demands Supply Demands Supply Heat Energy conversion Power Exports Buildings Space Regional characteristics (climate, soil topography, etc) Socio-economic location choice module Demographics Clean water Infra-structure selection module Water services Transport Travel Grey water Investments waste Waste services Public sector Technology scenario Supply characteristics (costs & emissions) ReVISIONS Regional Visions of Integrated Sustainable Infrastructure Optimised for Neighbourhoods
Overview: Spatial design options Compaction (Rogers) Edge Planned Extensions London Region (Corine land cover maps European Environment Agency) Flemish Region Corridor New settlements Free market (Barker) ReVISIONS Regional Visions of Integrated Sustainable Infrastructure Optimised for Neighbourhoods
Spatial planning policy and urban form Sustainability potential when considering; travel, energy, transport, water and waste? (photographs from Harrison, 2008). • Urban form affects • Settlement size • Clustering • Density • To estimate potential of ‘green technologies’ we need to represent the variation of buildings and patterns
The land scenarios • Trend: government population, household and employment forecast. Location of development at Ward level will aim to represent the Local Development Framework policies in the case study areas. • Market led: assumes a greater release of land in areas with pressure growth. Greater release of green field land but outstanding natural beauty areas would be protected. • Compaction: only previously developed land in urban centers with good public transport accessibility considered for development. • Planned settlements and urban expansion: This is similar to the market led option but planned to avoid sprawl and settlements large enough for self containment Scenarios ReVISIONS Regional Visions of Integrated Sustainable Infrastructure Optimised for Neighbourhoods
Technology scenarios These fall into three main categories: • Trend – continuation of current rates of introduction and investment • Environmental – emphasis on achieving environmental targets. This favours green technologies that achieve the greatest potential for reducing environment impacts. • Austerity – emphasis on cost effectiveness. This assumes that there will be less funding for subsidies and major investment schemes and imported materials become more expensive. ReVISIONS Regional Visions of Integrated Sustainable Infrastructure Optimised for Neighbourhoods
Forecast years and Independent scenarios • Forecast years • Base year 2001 • Main forecast year 2031 • Less detailed forecasts to 2051 • Climate • UKCP medium emissions 90% probability scenario • Economic growth • OBR ‘lost decade’ forecast • OBR central forecast ReVISIONS Regional Visions of Integrated Sustainable Infrastructure Optimised for Neighbourhoods
District scale land use model zones ReVISIONS Implementation Regional Visions of Integrated Sustainable Infrastructure Optimised for Neighbourhoods
Converting District forecasts into built form per Ward For the 2001 Base year • The mix of dwellings and average densities come from the Census and General Land Use Database mapping • Use English House Condition Survey to estimate the density distribution per dwelling type • Approximate these distributions using a mixture of discrete 1 ha tiles • This provides an account of the building stock per Ward. • The tiles include the building and plot dimensions, and the demands and supply characteristics for energy water and waste For the forecast year • Estimate the average densities of development per District using land inputs and Land Use model household and employment forecasts • Estimate the mix of building types using the frequency distributions established from the base year data • Output the tiles to represent the future building stock A similar method is used for non-domestic buildings based on Valuation Office Agency data
English House Condition Survey dwelling and area type data categories Average mix of dwelling types versus net density (Census & GLUD) Distribution of densities of a given dwelling and area type ReVISIONS Regional Visions of Integrated Sustainable Infrastructure Optimised for Neighbourhoods
Generic Tiles, (each tile is 1 hectare) Density of plots (dwelling per hectare) 9 20 30 50 117 220 390 460 1200 Detached House Courtyard Flat Slab Block Tower Block Terrace House Semi-detached House ReVISIONS Slide provided by Dr. Vicky Cheng Regional Visions of Integrated Sustainable Infrastructure Optimised for Neighbourhoods
Generic Tiles Dataset Tile S4: Semi-detached Slide provided by Dr. Vicky Cheng ReVISIONS
Purpose of the tiles • The range of building types is represented by the mix of tiles • The tiles encapsulate the demand and decentralised supply characteristics for energy, water and waste. • Supply characteristics depend on the area type, technology scenario and whether buildings are as existing, retrofitted, intensification or new build. • Spatial planning options change the land inputs to the land use District scale model and this affects the density of households and employmentand therefore the mix tiles at neighbourhood scale. • The demand and supply characteristics are automatically recalculated and aggregated based in area type and tile type for each scenario. ReVISIONS Regional Visions of Integrated Sustainable Infrastructure Optimised for Neighbourhoods
Chelmsford ReVISIONS URBAN FORM 24 | 05 | 2012 Regional Visions of Integrated Sustainable Infrastructure Optimised for Neighbourhoods
Increase from 2001 to 2031 (1=100%) Trend Compact The dwellings are targeted for each spatial policy are based on local planning policy informed by the Office for National Statistics Ward categories, (simplified into Central, Urban, Suburban and Rural) Market led ReVISIONS Regional Visions of Integrated Sustainable Infrastructure Optimised for Neighbourhoods
Proportional changes in dwellings by type 2031 Trend vs 2001 Base year Market Led vs Trend Compaction vs Trend
Cellular Automata modelling of Chelmsford Slide provided by Dr KirilStanilov, Department of Architecture, University of Cambridge 2001 – existing land use 2031 – Trend land use
2031 Options – detached houses Trend +955 du Compact +14 du Market led +2,580 du Slide provided by Dr KirilStanilov, Department of Architecture, University of Cambridge ReVISIONS Regional Visions of Integrated Sustainable Infrastructure Optimised for Neighbourhoods
2031 Options – flats Trend +2,599 du Compact +3,817 du Market Led +1,803 du Slide provided by Dr KirilStanilov, Department of Architecture, University of Cambridge ReVISIONS Regional Visions of Integrated Sustainable Infrastructure Optimised for Neighbourhoods
Building Energy Demand Town Centre (mixed used) Heat Electricity 1000 dwellings (1638 MWh) Tile D7 Shops (10608 MWh) Services (655 MWh) Restaurants (7162 MWh) Hotel (2083 MWh) Cinema (2415 MWh) ReVISIONS Provided by Dr. Vicky Cheng Regional Visions of Integrated Sustainable Infrastructure Optimised for Neighbourhoods
Low Carbon Energy Technology Potential Garden Area Roof Area Technology ReVISIONS ReVISIONS Slide provided by Dr. Vicky Cheng Regional Visions of Integrated Sustainable Infrastructure Optimised for Neighbourhoods Regional Visions of Integrated Sustainable Infrastructure Optimised for Neighbourhoods
Local example: Chelmsford Scenario: Low CO2 Low Cost Highly Electric Cost CO2 emissions
Flow chart for modelling framework Clustering as patterns Tiles per Ward Land use per District Domestic & commercial demand profiles per supply requirement Demands as ‘tiles’ per zone by residential & mixed-use type Spatial policy -changes in area type Total demands of activities by modelled time period per sq.m per zone and land-take Industrial processes demand profiles per supply requirement Demand per industrial sector per time period/zone Integrated socio-economic and spatial interaction model Supply module Demand module Technologies, constraints, & supply policies Total supply by modelled time period per LU zone – costs per unit, CO2 & renewables Supply profiles for industrial processes cost & quantity of supply Supply per industrial sector per time period/zone Supply for residential & mixed-use per time period/zone Supply profiles for domestic and commercial cost & quantity of supply Technology selection Costs & emissions per tile Aggregate to Sub region
Examples of forecast outputs • Land use modelling – employment & household location, GVA, costs of living and production by household type and industrial sector per District • Transport– travel time and costs by mode, energy consumption and emissions or different technologies. • Tiles – buildings by type, dimensions, floorspace, land areas, occupancies. • Buildings – energy demands by type, time and season for existing, retrofitting and new build • Energy conversion – costs and emissions for different decentralised technology scenarios • Water – water demands and supply technologies costs, CO2 emissions, and potential of decentralised measures to reduce water stress • Waste – waste arising, energy and nutrients recovery, materials recycling and global and UK GHG emissions • Multi criteria assessment will be used to trade off the economic, health, social and environmental impacts, using stakeholder value judgements. ReVISIONS Regional Visions of Integrated Sustainable Infrastructure Optimised for Neighbourhoods
ReVISIONS Regional Visions of Integrated Sustainable Infrastructure Optimised for Neighbourhoods Thank you www.regionalvisions.ac.uk International Symposium, Sao Paulo, 18th June 2012