Download
1 / 54
540 likes | 623 Views
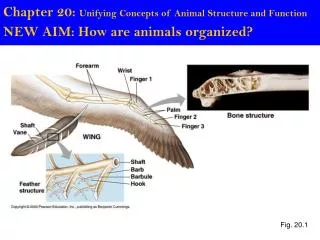
Information on the structure and function of “UTF” habitats. Malcolm Clark, Owen Anderson NIWA, Wellington. Revised presentation material for Deepwater Group Ltd Orange Roughy AEEF August 2013 . Presentation content.

E N D
Information on the structure and function of “UTF” habitats Malcolm Clark, Owen Anderson NIWA, Wellington Revised presentationmaterial for Deepwater Group Ltd Orange RoughyAEEF August 2013
Presentation content • Metrics and information on “UTFs” in ORH3B (NWCR, ESCR), ORH2A-2B-3A (MEC) and ORH7A (includes Westpac Bank region) • UTF features, based on NIWAs “seamount database” • Catch-effort data from MPI (Fisheries) • Coral data from various NIWA sources • Summary of structure and function of benthic habitats on “UTFs” • largely a general description about UTF communities • Links to information presented on protected coral species • Information on changes in benthic fauna on Morgue in the Graveyard Hills complex. • Based on 2001, 2006, 2009 surveys
UTF features in NZ region • Defined as seamounts, hills, knolls • not canyons, valleys, ridges, plateaux, banks etc • NIWA “Seamounts database” holds information on: • 1517 features • 892 inside the EEZ • 625 outside the EEZ • Seamounts (>= 1000 m elevation) 409 • Knolls (500-999 m) 426 • Hills (100-499 m) 682
Specific QMA UTF metrics Note: Depth is summit depth. Main fishing range for ORH is on hills and knolls with summit depths 600-1199 m (hence highlighted).
QMA UTF summaries (summit depth 600-1199 m) Knoll and hill characteristics vary between fishing areas, most features small in both elevation and size (<10km2 basal area), and moderate slope.
Catch data • Data assimilated from various sources to include as much of the historical ORH fishery as possible. • The distance to the summit point of the nearest UTF was calculated for the start position of each record, using a subset of the seamounts in the “Seamounts” database. The subset included all UTFs with summit depth between 400 and 1500m. • Records were assigned to the nearest UTF if the trawl start position was <= 2 n.milesfrom the location of the peak, if the trawl was <= 30 minutes in duration, and if trawl start depth <UTF base depth. • Note: start depth was not compared with summit depth, because of variable landing depth depending on UTF terrain (e.g., rugged on summit, or upper flanks) • Note the data are only TCEPR, so missing CELR where no position (mainly affects 1980s-early 1990s fisheries).
UTF assignment is tricky • Small features, often close together, 1 n.mile precision of most TCEPR records, vessel position recorded. • Most OK, but some mis-assignment in UTF clusters (e.g., Andes)
UTF catch summaries • The following slides show the 4 fishery areas • For each, all UTFs are plotted • The UTFs with summit depths between 600 and 1199 m are highlighted in yellow • The total historical catch of ORH on each UTF is displayed as an expanding symbol plot • These figures serve to show the varying relative importance of the UTFs for orange roughy fisheries • Full catch data are available, but not presented here
CHAL UTF catch EEZ ORH 7A Note the extension of the EEZ is recognition of a straddling stock of ORH Total catch of ORH off UTFs estimated at 12,800 t
MEC UTF catch Total ORH catch off UTFs estimated at 3,000 t (known to be low)
NWCR UTF catch Total catch of ORH off UTFs estimated at 16,100 t
ESCR UTF catch Total catch of ORH from UTFs estimated at 96, 800 t
UTF effort summaries • The following slides summarise effort data (bottom trawling) for the 4 fishery areas • A tow is one where ORH was the reported target species, or ORH was recorded in the catch • Each area is summarised separately • Tables are given which show the total number of trawls on each feature by year, where summit depth is 600-1199m, and years are 1990 onwards (when tow data are more reliable) • Plots are made showing all UTFs • The UTFs with summit depths between 600 and 1199 m are highlighted in yellow • The total number of trawls on each UTF is displayed as an expanding symbol plot • These figures serve to show the relative effort on UTFs in orange roughyfisheries • Information also given on protected status of UTFs in each area
NWCR effort (number of tows) Most effort on two hills Many with only a few tows
ESCR effort (3) Most ORH effort is on the hills on the eastern side of the Chatham Rise, with small catches occurring in the oreo fisheries to the west.
Relative effort on UTFs Graphs show proportion of tows on UTFs (with 600-1199m summit depths) against the total number of tows in the fishery areas (so including the slope)
Trawling within a UTF • As seen with an earlier slide on trawl assignment to UTFs, there are issues with the underlying effort data that limit the ability to accurately plot trawl tracks on a UTF • Where a UTF is reasonably large (several km2), and tows are relatively long (about 1 n.mile or more (>15 minutes towing)), then start-finish is informative • In the following slides we show such data for a number of UTFs in the 4 fishery areas. We use a “weather vane approach) which plots tow direction by sector ( the number is proportional to length of vane, and tow distance is colour-coded) [note “calm” is the proportion of zero distance tows] • More work is required, but this preliminary analysis demonstrates the variability in tow lines and trawl duration between UTFs.
Stony coral benthic habitat on UTFs • Reef-building stony corals (O. Scleractinia) are the main habitat-forming taxa on UTFs • 4 principal species of relevance to ORH fisheries (in the appropriate depth range –see Corals presentation) • Solenosmiliavariabilis • Madreporaoculata • Enallopsammiarostrata • Goniocorelladumosa
Distribution of stony corals on UTFs • Links with distributional data in Corals presentation • Point sample distribution and depth of the 4 reef-building species were compared with location and depth of UTFs • The following plots show the distribution of UTFs in the 4 fishery areas, and those with records of the 4 species • Note that coverage is incomplete, and many UTFs have not been sampled.
Stony coral habitat “catch” • Data analysed from Scientific Observer Programme records between 2007/08 and 2009/10 years (Tracey et al. 2011) • 5926 ORH-target trawls observed • Divided by Fishery Area • CHAL: 151 tows, 0 catch • MEC: 86 tows, 0 catch • NWCR: 318 tows, 26 with reef-building corals, 0 UTFs with catch. • ESCR: 2658 tows, 155 with reef-building corals, 3 UTFs with catch • More detail given in Revised coral presentation
Objective 2: Structure and Function • Role of UTFs summarised in Pitcher et al. (2007), Clark et al. (2010) and Rowden et al. (2010) • Important as benthic habitat for fishes • Many fish are associated with UTFs • Either enhanced numbers or biomass (UTF preference) • Or similar to slope (more generalised association with deep-sea habitats) • Clear role for ORH spawning • Feeding very important • Nursery grounds not known • Important as benthic habitat for invertebrates • Wide depth range offered by UTF elevation • Hard surfaces for attachment of sessile animals • Current flow enhanced increasing food supply • Regular input of food from DSL migrations • Variable substrate suitable for a wide range of biodiversity
The importance of UTFs • There are many “paradigms” about seamounts, knolls and hills that characterise them as: • Unique-having high levels of endemism • Diverse-being hot spots of biodiversity • Productive-having enhanced production and biomass • Often, these findings have been driven by limited sampling • Some are true for some UTFs, some are not • Typically difficult to generalise the ecological characteristics of UTFs • Next few slides deal with some NZ-Australian studies
Endemism • A difficult ecological aspect to address • Some UTFs do appear to be unique in having very specific physical characteristics (e.g., isolation, hydrothermal venting, very shallow, very deep etc) • More sampling generally tends to reduce the numbers of “unique” species • Typically in NIWA surveys, we find 5-10% of benthic invertebrates are new to science or new records for the NZ region • Recent reviews tend to suggest UTF endemism at levels of 10-20% on a ”regional” scale
Macro-invertebrate biodiversity Some NIWA assemblage results Chatham Rise Northland Plateau Hikurangi Plateau Kermadec Ridge averaged data Porifera Mollusca Bryozoa Polychaeta Benthic invertebrate assemblages show different patterns-some UTFs close together (indicating faunal similarity) for some taxa, others distant
Macro-invertebrate biodiversity patterns • Comparing biodiversity of New Zealand UTF assemblages to those from slope habitats elsewhere in region again show variable patterns by taxa • However, level of ‘apparent endemism’ is potentially high because of various sampling artefacts: • Diversity increases with sampling effort, so rare species can be hard to sample • Studies comparing different habitats are increasing, so the regional species “pool” increases
‘Distinct’ communities idea decreasing • UTF communities often contain species found elsewhere But, despite similar species lists (composition) species attain different biomass/abundance on UTFs changing the structure of communities The figure to the right shows a similar species mix in the canyon and seamount, but very different rank abundances McClain et al (2009)Plos ONE, Vol 4, e4141
High ‘biomass’ associated with UTFs • Well known for pelagic fish and demersal species such as ORH • Single study only for benthos, comparing 20 SW Pacific UTFs (mainly hills) with adjacent slope • Overall biomass of benthic communities was 4 times that of slope • Stony corals were the main driver (29 times higher) Rowden et al (2010)Marine Ecology, Vol 31
Resilience • Community/species Resilience • Depends on size and form • Clark et al. (2010) included the table below, illustrating some species can withstand bottom trawling (within limits)
Vulnerability of stony corals • Clark et al. (2010) • Some taxa highly vulnerable (e.g., stony corals) • Koslow et al (2001), Clark & Rowden (2009) comparing fished and unfished UTFs • Both studies found a strong relationship between the extent of bottom trawling and extent of cover of biogenic habitat (stony coral reef) • Also difference in benthic community composition between fished and unfished • Not necessarily cause and effect, but strong inferences that trawling is contributing factor • Stony coral structure is very fragile and fragments with contact
Graveyard hills, 2001 Percentage cover of still images by intact stony coral matrix Fished: 4% of image area Unfished: 25% of image area MDS plot of community assemblage composition (p/a) in epibenthic sled catches between fished (red) and unfished (yellow)SIMPER: 75% dissimilar. 3 discriminatory species identified (e.g. stylasterid corals) more common on fished hills
Morgue analyses, 2001 compared with 2006 2001 survey, no coral found, but 2006 dense intact coral surveyed on SW ridge line. Confirms Morgue is suitable habitat. No corals seen on Graveyard.
Morgue trawling • The image isn’t very easy to see with the cream colour, but some observations on trawling: • Short trawls common generally to the east and south. Some longer tows in other sectors, except north and southwest • Agrees with topography in terms of avoiding the ridges to the NE and SW
Coral cover versus fishing effort Ghoul, Pyre, Gothic 0-4 trawls Diabolical 11, Graveyard 2000 trawls Clark et al. 2010b
Effects of trawling • Direct physical impact is clear • Less easy to evaluate are the indirect effects, such as: • Sedimentation cloud • Sediment/substrate reworking • Chemical changes • Water quality etc • UTFs are often thought as rocky and always hard substrate. • But can be highly patchy e.g., mud, sand, gravel Refer K-means substrate Clark et al. 2010b
Objective 3: Graveyard seamounts Fished (red) and unfished (black) seamounts, plus gradient in fishing pressure In 2001 Morgue, Pyre & Gothic were protected So have fished-fished, fished-closed, unfished-unfished
Surveys No. stills 2001: 225 2006: 2635 2009: 1544 2001 less frequent images, and lower image resolution
Temporal changes: Intact coral Stony coral matrix: Changes difficult to discern from sampling distribution. 2001 poorer coverage. Overall, No strong changes Graveyard (fished), no coral; Diabolical (lightly fished) and Morgue (unfished since 2001), small patches; Gothic (unfished), extensive cover Note: SW sector of Morgue removed to be comparable with 2001
Morgue: temporal changes Crinoids Anemones Hydroids 2006 2001 2009