Download
1 / 5
50 likes | 202 Views
Supplementary Figure 1. Similar results to those showed in Figure 3B are depicted but at a different DC:MLR ratio (1:128). Supplementary Figure 2. n.s. n.s. The involvement of TGF-b and iNOS in Tol-DC immunomodulatory properties was studied in vitro . The

E N D
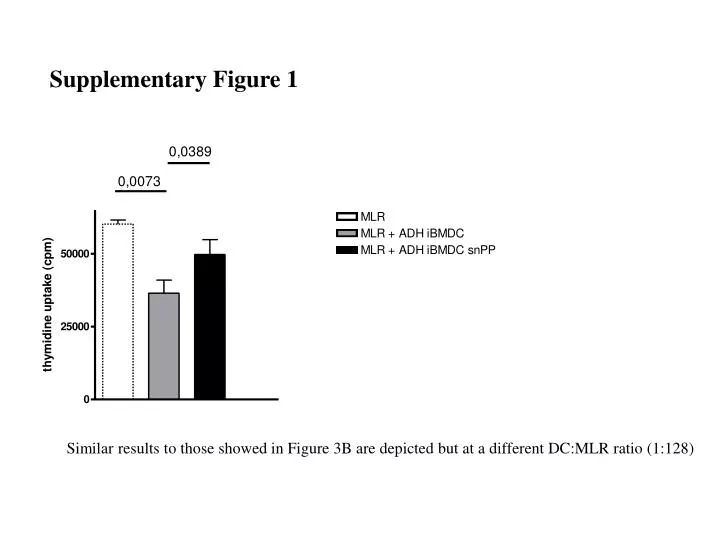
Supplementary Figure 1 Similar results to those showed in Figure 3B are depicted but at a different DC:MLR ratio (1:128)
Supplementary Figure 2 n.s. n.s. The involvement of TGF-b and iNOS in Tol-DC immunomodulatory properties was studied in vitro. The nitric oxyde synthase inhibitor L-NMMA and its inactive control molecule, D-NMMA were added to cultures containing a naif MLR and NHP Tol-DC (1:64 ratio). A neutralizing anti-TGF-b antibody (2G7 clon) and control mouse IgG were also added to the cultures and responder T cells proliferation was studied. Neither iNOS inhibition nor TGF-b blockade were able to impair Tol-DC-induced inhibition of T cell proliferation. Ns = non significant, numbers in the graphic indicate the p value.
Supplementary Figure 3 n.s. *** * The involvement of IL-10 in Tol-DC immunomodulatory properties was studied in vitro. An anti-IL-10 antibody was added to cultures containing a naif MLR and NHP Tol-DC (1:64 ratio). In contrast to HO-1 inhibition (SnPP treatment), IL-10 blockade was not able to impair Tol-DC-induced inhibition of T cell proliferation. ns = non significant; * = p<0.05; *** = p<0.001
Supplementary Figure 4 Untreated LPS SnPP LPS + SnPP 40 14 42 11 CD80 MHC II 7 15 7 16 CD86 MHC II HO-1 inhibition does not modify rat BMDC expression of neither costimulatory molecules nor MHC class II. BMDC were treated during 48 hs with the indicated compounds (SnPP: HO-1 inhibitor). Numbers in the graphics represent the percentage of double positive cells. n=3.
Supplementary Figure 5 64 DDAO DDAO 69 without IL-2 + IL-2 18 Untreated SnPP 22 Rat BMDC do not expand CD4+CD25+ Treg. Treg were cultured with allogeneic untreated BMDC or pulsed 2h with SnPP at 37°C. A three day culture was performed in the absence (left panel) or presence (right panel) of 50 U/ml IL-2. CD4+CD25+ proliferation was studied by FACS through analysis of the dilution of the fluorogenic probe DDAO. The numbers in the graphics represent the percentage of non-dividing cells. n=3