Download
1 / 27
270 likes | 443 Views
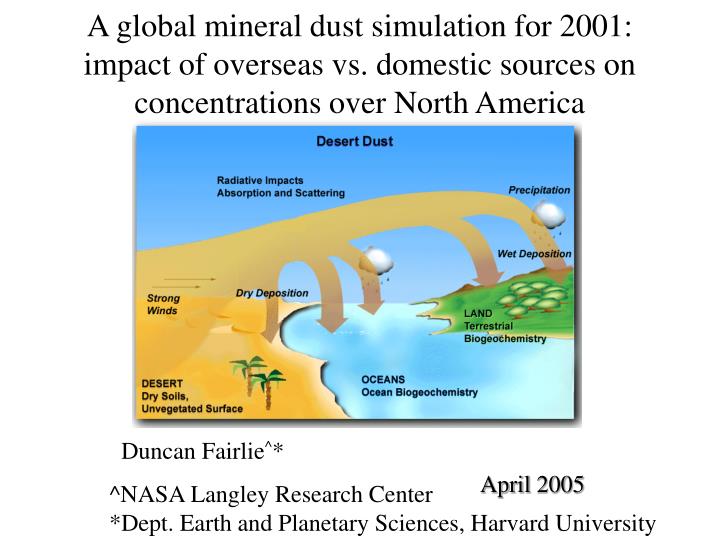
A global mineral dust simulation for 2001: impact of overseas vs. domestic sources on concentrations over North America. Duncan Fairlie ^ *. April 2005. ^NASA Langley Research Center *Dept. Earth and Planetary Sciences, Harvard University. Mineral Dust Module in GEOS-CHEM.

E N D
A global mineral dust simulation for 2001: impact of overseas vs. domestic sources on concentrations over North America Duncan Fairlie^* April 2005 ^NASA Langley Research Center *Dept. Earth and Planetary Sciences, Harvard University
Mineral Dust Module in GEOS-CHEM • Dust mobilization (emission): • (1) Ginoux et al. (2001) for GOCART model • (2) Zender et al. (2003) for DEAD model • Dry deposition – grav. settling, turb. transfer, impact., intercep. (Zhang et al. 2001); Vd=Vd(D,r,sfc). • Wet deposition – aerosol scavenging in convective updrafts, first-order rainout and washout from anvils and stratiform precip., plus cirrus precip, reevap. (Liu et al., 2001). • Size bins: 0.1-1.0, 1.0-1.8, 1.8-3.0, 3.0-6.0 mm radius • (following Ginoux et al., 2001)
Mobilization • Generally, Fd = C S a Qs Fd – vertical dust flux Qs – horizontal saltation flux S – source function (defines potential dust source regions, and comprises surface factors, e.g. vegetation, snow cover, and an efficiency factor e.g. topographic anomaly) • GOCART: Qs ~ U102 (U10 – U*t) • DEAD: Qs ~ U*3 (1-U*t/U*) (1+U*t/U*)2 U*t – threshold friction velocity (particle size, density; air density, viscosity). U*t modulated by surface moisture.
Essential difference between Ginoux (GOCART) and Zender (DEAD) schemes Do seasonal vegetation change and human activities crucially affect dust sources? NO (Ginoux et al.): Source areas prescribed. Focus on topographic lows in desert and semi-desert regions: ephemeral lakes, dry river beds. Yes (Zender et al.): Source areas not predetermined, but largely controlled by changing LAI. Focus on upstream runoff area. [Snow cover also mitigates mobilization in DEAD.]
GOCART and DEAD source potentials October 2001 GOCART source Veg.(LAI) 0.02 2.0 0.02 2.0 4.0 DEAD source Effic. 0.02 2.0 0.02 2.0 1.4
April April 1000 1000 October October 1000 1000 PM2.5 Columns (mg/m2), Apr/Oct 2001 DEAD GOCART Burdens: April October DEAD 33Tg (fine: 12Tg); 17Tg (fine: 6Tg) GOCART 46Tg (fine: 17Tg); 35Tg (fine: 12Tg)
Key Questions • What is the impact of overseas (in particular transpacific) transport of dust on aerosol concentrations over North America? • What are the key factors that control dust mobilization from the Earth’s surface?
IMPROVE site locations • IMPROVE aerosol network: focuses on visibility in Fed. 1 sites • data for aerosol sulfate, nitrate, ammonium, elemental carbon (EC), • organic carbon (OC), fine and coarse dust, sea salt. • Fine dust (PM2.5) = 2.2*Al+2.49*Si+1.63*Ca+2.42*Fe+1.94*Ti • (Malm et al., 1994)
PM2.5 seasonal-average surface dust concentrations (mg/m3), 2001 IMPROVE GOCART DEAD DJF MAM Persistent High bias JJA Spurious emissions SON mg/m3 0 2 4 0 2 4 0 2 4 GOCART: dust sources in SW CONUS too strong and sustained DEAD: spurious sources in N. plains corrupt eastern sites
Remedies? DEAD scheme: Restrict emissions to desert and semi-desert regions over CONUS GOCART scheme: raise threshold velocities or otherwise scale back emissions Choose DEAD formulation with latest GOCART source fn.
0 2 4 0 2 4 0 2 4 PM2.5 seas.-ave. (mg/m3), 2001DEAD with GOC. source IMPROVE Model Overseas DJF High bias MAM JJA Low bias SON Use of GOC. source eleviates issues with GOCART and DEAD schemes. But, low bias at eastern sites in JJA, SON, and high bias NW in MAM.
Model vs. IMPROVE PM2.5 by season (mg/m3) GOCsrce West East + west o east DJF MAM Model JJA 10 SON 0.1 10 10 10 IMPROVE IMPROVE Model pdfs Use of DEAD with GOC. source. improves in West, eliminates spurious high values in East, but leaves East biased low.
What’s happening in April, May? 10 10 Mount Hood, OR Hells Canyon, OR 10 Model pulses in early May in NW overestimate observed values. IMPROVE Model (mg/m3) Mount Rainier, WA
Total dust conc. vs. U. Miami climatologies GOCsrce Hedo Midway Asia/ N. Pacific DEAD Oahu (mg/m3) Izana Mace Sal E. Atlantic Barbados Miami Bermuda W. Atlantic Reproduces seasonal cycle over N. Pacific. GOC. source raises –ve bias over DEAD run.
Comparison with U. Miami climatologies Medians U. Miami Ratio DEAD Ratio GOCsrce Medians (mg/m3) Some improvements with GOCsrce in SH; -ve bias reduced
Summary • Choice of 2 mobilization schemes in GEOS-CHEM. GOCART scheme generates about twice as much dust as DEAD with current parameters. Both have issues over North America. • Use of LAI as a sole vegetative constraint on emission appears problematic (DEAD scheme). No account for senescent vegetation nor land management practices. Recommend use of DEAD with latest GOCART source potential. • All solutions capture seasonal cycle over Northern Pacific in 2001, with background levels consistent with U. Miami observations. (4) Comparisons with TRACE-P and ACE-Asia bulk aerosol show good agreement, 30% negative bias, respectively. (5) Results suggest that transpacific transport may contribute between 0.3 and 0.6 mg/m3 (seasonal mean) at surface sites in NW states for JJA and SON [c.f. EPA default estimate of fine dust nationwide of 0.5 mg/m3.] However, indication that overseas contribution at NW sites are biased high. Also, other years need attention.
Asian Rim DC8 flights for TRACE-P, March 2001 [www-gte.larc.nasa.gov] C130 flights for ACE- Asia, April 2001 [Huebert et al.] In-situ bulk aerosol measurements made by UNH (Talbot, Dibb, et al.) during TRACE-P. Measurements made by U. Hawaii (TAS) (Huebert et al.) during ACE-Asia. Use Ca2+ and Na+. Account for sea salt-Ca2+ contribution (ss-Ca2+ = 0.0439 ss-Na+ neq., Wilson, 1975). Assume Ca2+ = 6.8% dust by mass (Wang, 1999; Song and Carmichael, 2001), following Jordan et al. [2004].
Comparison with bulk aerosol dust from TRACE-P (Dibb et al.) March, 2001 Use of GOCsrce raises negative bias experienced with DEAD
Comparison with bulk aerosol dust from ACE-Asia (TAS, Huebert) April, 2001. GOCsrce shows a more unimodal distribution, similar to TAS but is biased low.
PM2.5 monthly average-average (mg/m3) IMPROVE GOCsrce Overseas March April May June Springtime anomaly in NW between model and IMPROVE concentrated in May.
Jan Apr GOCsrce emissions Oct Jul DEAD formulation provides a consistently defined threshold
Jan Apr GOCsrce PM2.5 columns Oct Jul
Jan Apr GOCsrce drydep Oct Jul
Jan Apr GOCsrce wetdep Oct Jul
Mobilization: DEAD Dust mobilisation directly related to horizontal saltation flux: Fd = Am S a Qs. Qs = csr/g U*3 (1-U*t/U*) (1+U*t/U*)2 • U*t = U*t MB (particle size, density; air density, viscosity). U* computed for D=75 um. • U* friction velocity (roughness, z0=1.0e-4 m) • surface wetness modulates U*t (Fecan et al., 1999) • S - efficiency factor - Am =(1-Al-Aw)(1-As)(1-Av) - VAI < 0.3 time-varying - snow cover < 5 cm