Download

1 / 19
190 likes | 343 Views
Spreadsheet print screens. I used my questionnaire questions for my spreadsheet. I used the data validation rule to validate each box so that no one can type irrelevant information into my spreadsheet. Testing validation.

E N D
I used my questionnaire questions for my spreadsheet. I used the data validation rule to validate each box so that no one can type irrelevant information into my spreadsheet.
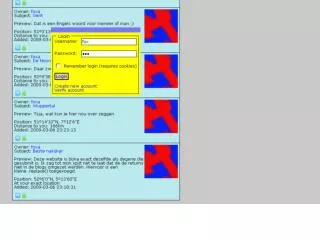
Testing validation To test the validation for my spreadsheet I attempted to enter some random words in to my survey. The error box proves that my validation works because it won’t allow unrestricted words to be entered
COUNTIF For countif I had to go to the small fx sign then search for the countif function. Once I had selected the countif function I had to enter the range or highlight the specific range e.g.. Foodpref or Healthy. Then I had to select the criteria I wanted such as “Meat” for Foodpref. I had to remember to put my criteria in speech marks so it would work.
COUNTIFS For countif I had to go to the small fx sign then search for the countif function. Once I had selected the countif function I had to enter the range or highlight the specific range e.g. Foodpref or Healthy. Then I had to select the criteria I wanted such as “Meat” for Foodpref. I had to remember to put my criteria in speech marks so it would work. Then I had to repeat this again for Countifs.
gender For each question I used the countif formula to collect my results then plotted them in graph form.
age For each question I used the countif formula to collect my results then plotted them in graph form.
Healthy? For each question I used the countif formula to collect my results then plotted them in graph form.
Food preference For each question I used the countif formula to collect my results then plotted them in graph form.
HEALTHY PORTION SIZES? For each question I used the countif formula to collect my results then plotted them in graph form.
Eat 5 a day? For each question I used the countif formula to collect my results then plotted them in graph form.
Water consumption For each question I used the countif formula to collect my results then plotted them in graph form.
Keeping active? For each question I used the countif formula to collect my results then plotted them in graph form.
How often? For each question I used the countif formula to collect my results then plotted them in graph form.
How long? For each question I used the countif formula to collect my results then plotted them in graph form.
Improving well being For each question I used the countif formula to collect my results then plotted them in graph form.
How often? For each question I used the countif formula to collect my results then plotted them in graph form.
Preferred activity For each question I used the countif formula to collect my results then plotted them in graph form.
With friends or alone? For each question I used the countif formula to collect my results then plotted them in graph form.