Download
1 / 23
230 likes | 326 Views
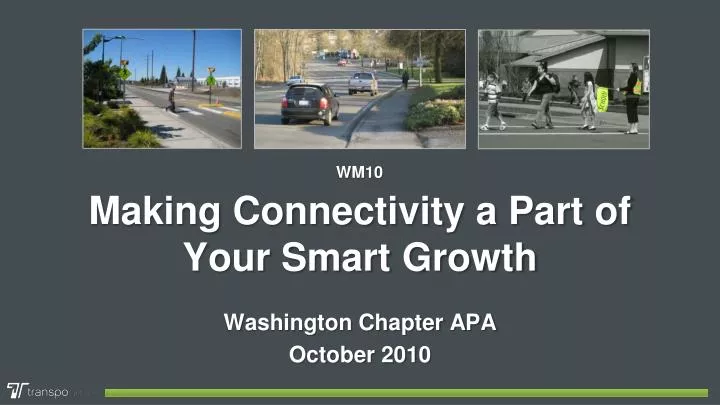
Making Connectivity a Part of Your Smart Growth. WM10. Washington Chapter APA October 2010. CONNECTIVITY’S GREATEST HITS. Love Thy Neighbor. Ross Racine. Ross Racine. Driving & the Built Environment – the 5 D’s.

E N D
Making Connectivity a Part of Your Smart Growth WM10 Washington Chapter APA October 2010
CONNECTIVITY’S GREATEST HITS
Driving & the Built Environment – the 5 D’s Density Population & employment by geographic unit (e.g., per square mile, per developed acre). Diversity Mix of land uses, typically residential and commercial development, and the degree to which they are balanced in an area (e.g., jobs–housing balance). Design Neighborhood layout and street characteristics, particularly connectivity, presence of sidewalks, and other design features (e.g., shade, scenery, presence of attractive homes and stores) that enhance the pedestrian- and bicycle-friendliness of an area. Destination accessibility Ease or convenience of trip destinations from point of origin, often measured at the zonal level in terms of distance from the central business district or other major centers. Distance to transit Ease of access to transit from home/work (e.g., bus/rail stop within ¼ to ½ mile). Ewing & Cervero, JAPA, Summer 2010 | TRB Report #298
DOT – HUD – EPA Partnership for Sustainable Communities Livability Principles Improve access to affordable housing More transportation options Lower transportation costs while protecting environment Partnership Agreement Develop livability measures and tools Undertake joint research & data collection
Connectivity & Active Living International Journal of Health Geographics– Berrigan, Pickle, Dill Los Angeles and San Diego Counties Applied 9 measures of street connectivity Identified positive correlation between connected street system and the propensity and duration of leisure walking and cycling
“ “ Draft FTA Policy – Connectivity Nexus FTA encourages the use of its funds for the type of well-designed pedestrian and bicycle amenities that attract new public transportation riders by expanding the catchment area and utility of public transportation stations. (Proposed FTA Policy Statement on the Eligibility of Pedestrian and Bicycle Improvements Under Federal Transit Law. November 6, 2009)
Rail Station Connectivity –Comparing Metrics Before After Change Parcel Impact Route Directness Index 2,300 0.63 0.77 23% Intersection Density 146 1.4% -- 144 Link-Node Ratio -- 1.29 1.30 < 1% Walk Score -- -- -- 89 of 100
Basic RDI Calculation A B straight-line distance “A” actual route distance “B” RDI = A / B
RDI Example: Pre Neighborhood Connector 375 ft 1850 ft RDI: .20 1850 ft .20 375 ft Route Directness Index Crow Flight / Walk Distance = RDI Existing Shared-Use Path
RDI Example: Post Neighborhood Connector 375 ft RDI: .83 450 ft .83 375 ft 450 ft Route Directness Index Crow Flight / Walk Distance New Neighborhood Connectors = RDI Existing Shared-Use Path
Connectivity & Smart Growth Panel Dan Penrose, AICP City of Lakewood Sophie Stimson City of Olympia Thera Black Thurston Regional Planning Council Chris Comeau, AICP City of Bellingham
Active Living Index Applied Model DU’s within 15-minute Walk-To-School Baseline Conceptual Citywide Model • Independent Variables • S.F. DU’s within 1/2-mile of schools by Household Income and Auto Ownership • M.F. DU’s within 15-minute walk-to-school, by Household Income and Auto Ownership • Parcel-Measured RDI to School • School Enrollment • Sidewalk Coverage (if available) # Students Walk-To-School Plan Progress Reporting Plan Impact • Dependant Variable • # Students – Walk-To-School New Data Collection Students 3 x more likely to walk when route passes SR2S improvement CA 2007 Report