Download
1 / 19
240 likes | 873 Views
II. Operations Strategy and Process Choice . Operations Management and Competitive Advantages “An Efficiency Drive” “Case Study: Burger Time” Process Types and The Product-Process Matrix Case Discussion: Kristen’s Cookies Process Flow Diagram and Gantt Chart. An Efficiency Drive.

E N D
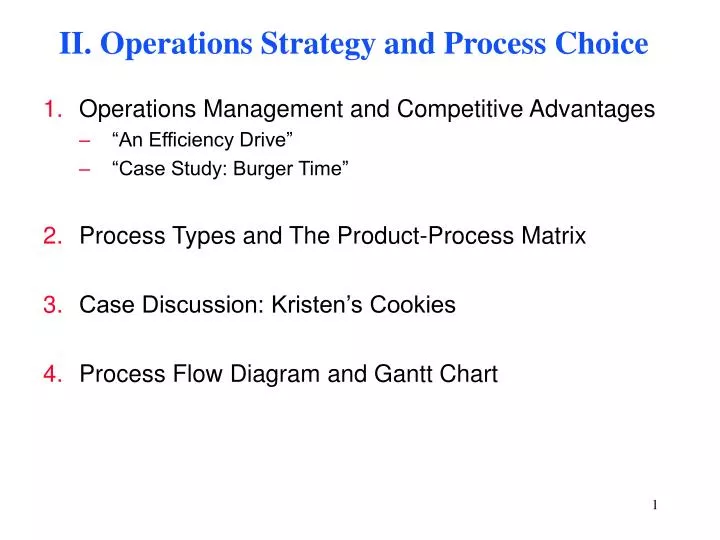
II. Operations Strategy and Process Choice • Operations Management and Competitive Advantages • “An Efficiency Drive” • “Case Study: Burger Time” • Process Types and The Product-Process Matrix • Case Discussion: Kristen’s Cookies • Process Flow Diagram and Gantt Chart
An Efficiency Drive • How critical is time for drive-through? • Is drive-through a good deal for the restaurants? • What are the efforts to save time? • Implications
Case Discussion: Burger Time • What are the major operational differences between McDonald’s and Burger King? • How do these differences relate to each company’s competitive strategies? • What implications do these differences have for the management of operations?
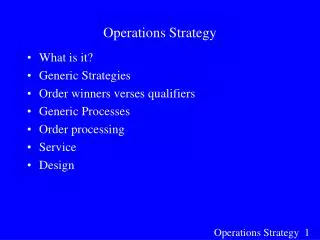
Competitive Advantages and Operations Management Competitive Advantages • Price • Cost • Quality • Customer service • Consistent quality • Time • Rapid, reliable delivery • Variety • Operations Management • Match supply with demand • Quantitative methods and qualitative strategies to • ensure efficient use of resources • find the right balance between competing objectives • improve performance along multiple dimensions simultaneously
Performance Dimensions in Retail Banking • Quality: courteous services, consistency (reliability), accurate information (credibility), empathy, timely information (customer responsiveness), conformance, employee skill and knowledge • Time: delivery speed (waiting time), convenient services (access), on time delivery (account statements), handling customer complaints • Flexibility: a broad line of financial products, system responsiveness, new product introduction speed, rapid staff changes, customizations • Cost: cost effective back and front-office labor productivity, cost effective back-office technology innovations, transaction processing costs
Low Cost & Scale Economies (< 1960s) Focused Factories (mid 1960s) Flexible Factories and Product variety (1970s) Quality (1980s) Time (late 1980s-1990s--> ) The changing sources of competitive advantage
Process types: Match Supply with Demand • Economics • Two options • Make supply after demand: Make to order (MTO) • Make supply before demand: Make to stock (MTS) • Matching supply with demand means
Process Types: Resource Types and Layout • Job Shop process • General purposed/flexible resources • Process focused layout: Jobs have flexible routing, go from one resource to another as needed • Wide variety of products, customized products • Batch process • Similar to JS, but with larger lot sizes, some EOS, more commonality in the resources required, still not cost effective to build a dedicated assembly line. • Discrete flow process • Product focused layout: Fixed (possibly automated) flow of products, tightly connected stages (WIP is automatically managed), specialized tasks • Heavily capitalized • High volume • Continuous flow process • Product focused layout • heavily capitalized • Product is a commodity – no discrete units, minimal variety, high volume
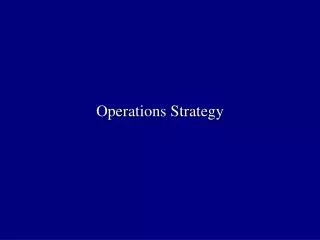
Opportunity Costs Out-of-pocket Costs Matching Products and Processes Product Low volume Low Standardization One of a kind Low volume Many Products Higher volume Few Major Products High volume High Standardization Commodity Products Process Scheduling, Materials Handling, Shifting Bottlenecks JOB SHOP Jumbled Flow. Process segments loosely linked. (Commercial Printer, Ph.D program) Disconnected Line Flow/Jumbled Flow but a dominant flow exists. BATCH Worker Motivation, Balance, Maintaining Flexibility (Heavy Equipment, MBA program) DISCRETE FLOWS Connected Line Flow (assembly line) (Auto Assembly) CONTINUOUS FLOW Continuous, automated, rigid line flow. Process segments tightly linked. Capital Investment for big chunk capacity, Technological Change, Vertical Integration (Oil Refinery) Managerial Challenges Bidding, delivery, product design flexibility Quality & Product Differentiation, output volume flexibility Price
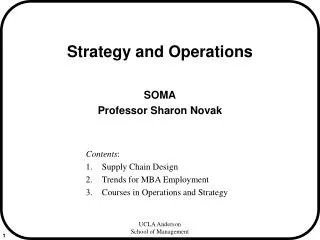
Set oven Mix Spoon Bake Cool Pack Pay Process Flow Diagram: Kristen’s Cookies Time 6 2 1 9 5 2 1 (minutes/dozen) Capacity (dozen/minute, for orders of 1 dozen) Max batch 3d d d d Resources K K R, Oven Oven R R
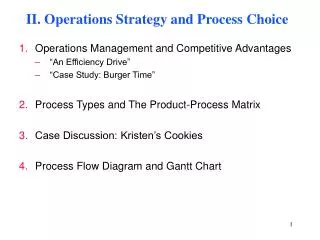
2nd Stage FB Reactor 1st Stage CFB Reactor CFB Preheater Inclined Bucket Elevator ~ 110 m Briquetting Plant Process Gas Heat Exchanger Process Gas Compressor Electrical Substation& Control Room Iron Ore Fines Fired Gas Heaters HBI Product ~ 160 m
Dis- charge Lock Hoppers 2nd Reactor 1st Reactor Pre-Heater Briquet- ting Flash heater Pile of Iron ore fines Finished goods
Process Flow Diagram and Gantt Chart • Process Flow Diagram: Illustrates the flow of product or service from input to final output (stages). • Software (Visio et al.) • Gantt Chart: Illustrates the interplay between resources at all time • Important for scheduling and coordinating production • Software (Microsoft Project)
Today’s Takeaways • Operations management and competitive advantages • Process Types and The Product-Process Matrix • Process Types • Matching supply with demand: MTO vs. MTS • Resource types and layout: job shop, batch, discrete flow, continuous flow • The Product-Process Matrix: Diagonal • Case discussion: Kristen’s Cookies • Process Flow Diagram and Gantt Chart • Flow Diagram: stages products flow through • Gantt Chart: interplay of resources Operational Measures