Download
1 / 28
280 likes | 373 Views
Examining Asymmetric Behavior between Energy Consumption and Economic Growth in Taiwan. Jin-Li Hu Cheng-Husn Lin Institute of Business and Management National Chiao Tung University http://www.cc.nctu.edu.tw/~jinlihu 2009.4.8. Agenda. Introduction Energy development in Taiwan

E N D
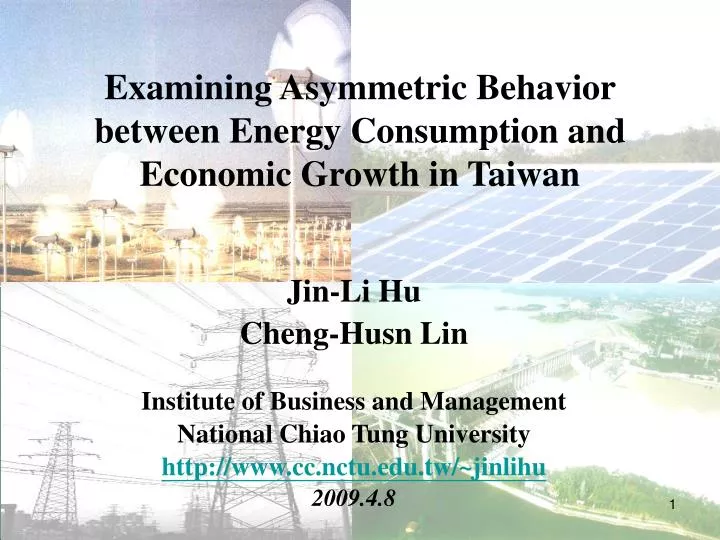
Examining Asymmetric Behavior between Energy Consumption and Economic Growth in Taiwan Jin-Li Hu Cheng-Husn Lin Institute of Business and Management National Chiao Tung University http://www.cc.nctu.edu.tw/~jinlihu 2009.4.8
Agenda Introduction Energy development in Taiwan Methodology Empirical results Concluding remarks
Introduction (1/9) • Since the early 1980s, energy demand on a national and international basis has been extensively analyzed, initially motivated by concerns about security due to energy supply in view of the twin oil price shocks and later because concerns about climate change. • Due to the growing pressure exerted on governments to mitigate carbon dioxide (CO2) emissions to slow down the rate of climate change, many countries worry about the negative impact on economic growth caused by the restricted use of fossil fuels.
Introduction (2/9) • Attention has recently been paid to obligations under the Kyoto Protocol that came into force in February 2005 • Many countries worry about the negative impact on economic growth by the restricted use of fossil fuels. • Developed countries have to reduce greenhouse gas emissions by at least 5% below the 1990 level, while the United States has agreed to reduce emissions from its 1990 levels by 7% inthe commitment period 2008-2012. • Improving energy efficiency as one of the most cost-effective ways to meet their commitments.
Introduction (3/9) • Recently, to respond to the influence of the Framework • Convention on Climate Change of the United Nations, Taiwan’s government held the National Energy Conference in 1998 and 2005 to decided upon appropriate strategies that are compatible with economic development, energy supply, and environmental protection (3E). • Carbon dioxide emissions are expected to reduce to levels of 38 million tons of oil equivalent (MTOE) in 2015 and to 78 MTOE in 2025, respectively
Introduction (4/9) • Government authorities should constructively give an impetus to the management of carbon dioxide emissions in the energy sector. • Energy investment plans: the measurement of greenhouse emissions for energy sectors, the adoption of suitable green technologies, and electricity supply should pay fees in terms of the portion of non-renewable generated electric power.
Introduction (5/9) • The research issue of energy-output relationship in energy field • Granger Causality • GDP→Energy: the policies for reducing energy consumption may be implemented with little or no adverse effects on economic growth, such as in a less energy-dependent economy • Energy→GDP: the use of energy consumption may adversely affect economic growth • GDP↔Energy: energy consumption and economic growth are jointly determined and affected at the same time • GDP Energy: the so-called ‘neutrality hypothesis’, means that energy conservation policies do not affect economic growth
Introduction (6/9) • Cointegration Analysis • Many recent studies explore the long-run equilibrium (or cointegration) relationship between energy consumption and economic growth with either a bivariate or multivariate framework. • Equilibrium theories involving non-stationary variables require the existence of a combination of variables that are stationary and cointegration does not require that the long-run equilibrium relationship to be generated by market forces or the behavioral rules or individuals. • The cointegration tests include: Engle-Granger (1987), Autoregressive distributed Lag (ARDL; Pesaran,1999), Johansen (1990), etc.
Introduction (7/9) • However, …….. • Enders (1995) points out that nonlinear long-run relationships possibly exist among a set of integrated variables. • Balke and Fomby (1997) argue that movement toward the long-run equilibrium not need to occur in every period relative to the conventional assumption-that is, a tendency to move toward a long-run equilibrium is present every time period.
Introduction (8/9) • Fortunately, some works may support our conjunction • Altinay and Karagol (2004) reports that the conventional unit root tests indicate the series contain a unit root, whereas the endogenous unit root tests reveal that the series are trend stationary with a structural break. • Lee and Chang (2005) find that gas consumption seem to have structural breaks in the 1960s for Taiwan. After considering the structural breaks, the series is a stationary variable when Taiwan adopts its expansionary export trade policy. (the cointegration between energy consumption and GDP is unstable, and some economic events may impact the stability) • Lee and Chang (2007) document that there exists a nonlinear relationship between energy consumption and economic growth in Taiwan by employing the threshold regression (TAR) in which the endogenous threshold values can be derived in energy consumption.
Introduction (9/9) • Research purpose • The aim of this paper is to examine the long-run relationship between energy consumption and economic growth for Taiwan using a newly developed momentum threshold-autoregressive (M-TAR) cointegration method by Enders and Siklos (2001), who allow for asymmetric behavior. • M-TAR adjustment can be particularly useful when policy makers are viewed as attempting to smooth out any large changes in a series. • Another purpose is to utilize the disaggregated energy consumption at the sector level to detect whether each is cointegrated with economic growth.
Energy development in Taiwan (1/3) • Energy-output nexus in Taiwan • 1980-1997: Taiwan’s economy enjoyed a remarkable annual economic growth rate of 7.59% and an average annual energy consumption growth of 5.84%, implying that domestic output consumes a relative lower level of energy. • 1998-2002: the average annual economic growth was 3.63%, while the average annual energy consumption growth still sustained at 5.58%, worsening energy efficiency. • Some violent exogenous event shocks to the domestic economic activity: the Asian financial crisis (1997-1999) and a recession in the global business cycle in 2001. • Energy over-consumption cannot effectively enhance economic growth and may generate disequilibrium between energy consumption and economic growth. • 2003-2006: energy consumption growth is 3.77% and economic growth is 4.51%, the per-unit production still needs to consume a near unit of energy.
Energy development in Taiwan (2/3) The sum of the percentage of energy consumption in residential, transportation and industrial sectors to total energy consumption grows up to 80% over past thirty years.
Energy development in Taiwan (3/3) • 2005 National Energy Conference • Carbon dioxide emissions are expected to reduce to 38 million tons of oil equivalent (MTOE) in 2015 and to 78 MTOE in 2025, respectively. • Taiwan’s government regulatory authority should establish a market mechanism to promote the rationalization of energy prices, liberalize the energy market, and consolidate the management of energy efficiency. • The structures of energy allocation percentage in 2025 are expected to drop to be fuel 41% to 45%, oil 32% to 31%, natural gas 16% to 19%, nuclear energy to 4%, and renewable energy 5% to 7%. • Energy investment plans
The Method (1/6) • Data sources • The data for Taiwan used in this study consist of total final energy consumption (EC), industrial sector energy consumption (IND), transportation sector energy consumption (TRA), residential sector energy consumption (RES), and GDP (Y). • All original energy consumption data are measured as kiloliters of oil equivalent (KLOE). The nominal gross domestic product series in the national currency is transformed into real gross domestic product in 2001 prices, using GDP deflators. • The empirical data are calculated as the quarterly growth rate and the sample period is from 1983:Q1 to 2006:Q4. • The source of the data is compiled from the AREMOS economic-statistic database.
The Method (2/6) • Threshold cointegration (Enders and Siklos, 2001) • Enders and Siklos (2001) make an extension to the two-step symmetric testing strategy of Engle and Granger (1987) to test for a long-run relationship between two time series variables which take asymmetry into account. • The resulting M-TAR testing procedure has shown good power and size properties relative to the alternative assumption of symmetric adjustment.
The Method (3/6) • First step • Using OLS method to estimate the following base model representing the long-run equilibrium relationship where Yt is economic growth, ECt is the energy consumption growth, and ut denotes the disturbance term that may be serially correlated. The existence of the long-run equilibrium relationship involves the stationarity of ut.
The Method (4/6) • Second step • To investigate the stationarity of ut, whether -2<ρ<0 has to be tested in the second step procedure given by where εt is the white-noise disturbance and the residuals from (1) are used to estimate (2). Rejecting the null hypothesis of no cointegration (i.e., accepting the alternative hypothesis -2<ρ<0 ) implies that the residuals in (1) are stationary with zero mean.
The Method (5/6) • Second step (continued) • The standard cointegration framework assuming symmetric adjustment toward equilibrium in (2) is misspecified if the adjustment process is asymmetric. Therefore, the residuals ( ) from (1) are then used to estimate the following M-TAR model: where ρ1 and ρ2 are the speed of adjustment coefficients of , and The lagged values of are supposed to yield uncorrelated residuals and can be determined by the AIC model-selection criteria.
The Method (6/6) • How to search the specified threshold value • The Heaviside indicator function is denoted as follows and is the threshold value. The threshold parameter , is endogenously determined using Chan’s (1993) method to search for the consistent estimate of the threshold. This method sorts the estimated residual series in ascending order and is called , where T denotes the number of usable observations. The largest and smallest 15% of the values are excluded. The estimated threshold yielding the lowest residual sum of squares is deemed to be the appropriate estimate of the threshold over the remaining 70%.
Empirical Results (1/4) • Unit root tests
Empirical Results (2/4) • The cointegration and asymmetry tests
Empirical Results (4/4) • Detecting the constancy of the cointegration space: CUSUMSQ tests for basis model
Concluding Remarks (1/3) • This paper considers the possibility of a nonlinear effect between energy consumption and economic growth due to the recent observations that energy consumption is higher than economic growth in Taiwan, worsening energy efficiency. We suspect that the relationship between energy consumption and economic growth has a disequilibrium condition. • Allowing for an asymmetric adjusting behavior of energy consumption and economic growth sheds new light on the explanation of the characteristics of the energy-growth nexus. • The threshold cointegration tests confirm that there is a nonlinear cointegration relationship between energy consumption and economic growth in Taiwan.
Concluding Remarks (2/3) • The estimated vector error-correction models provide strong evidence that the deviations persistently adjust toward long-run equilibrium in a relative energy-efficient regime for the aggregate-level and in a relative energy-inefficient regime for the sector-level. • The short-run weak exogeneity Granger causality tests support that there is Granger causality from energy to economic growth in the cases of the aggregate and industrial sector. • Policy-makers should take into account the asymmetric adjustment behavior of the energy-growth nexus when building estimation and prediction models of economic growth for Taiwan in the future.
Concluding Remarks (3/3) • Policy Implications • Implementing the energy demand side management (EDSM). • Propagating the importance of energy-savings through education, public media, and social public. • Legislative institutions and government sectors also should animate the liberalization of the energy market and consolidate the energy price mechanism to establish an efficient energy market. • Government authorities should make efforts on the developments of renewable energy such as wind power, solar energy, and biomass fuels. • Improving energy efficiency may alleviate the problems of greenhouse gas emissions as well as ‘decoupling’ between energy consumption and economic growth.
~ The End ~Any Questions?Pursuing Energy Sustainable Development