Download
1 / 34
340 likes | 428 Views
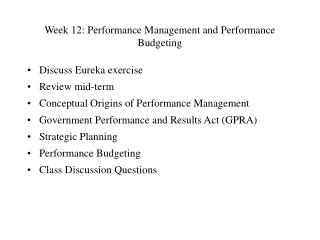
Paying for Results – Performance Funding. 2012 Complete College Ohio Conference Columbus, OH November 13, 2012. The Management Cycle of the Past. Institution. Goal-Setting. State. Institution. Institution. Resource Allocation. Assessment. The Management Cycle Now. State. Institution.

E N D
Paying for Results – Performance Funding 2012 Complete College Ohio Conference Columbus, OH November 13, 2012
The Management Cycle of the Past Institution Goal-Setting State Institution Institution ResourceAllocation Assessment
The Management Cycle Now State Institution Goal-Setting State State Institution Institution ResourceAllocation Assessment
Why the Renewed Interest in Outcomes-Based Funding • An increase in the number of states defining statewide goals for higher Education • Outcomes-based funding is the most direct way of linking state funding to these goals • An alternative to micromanagement – a way to negotiate autonomy with accountability
Outcomes-Based Funding is Not a New Phenomenon • Enrollment-based funding is a form of outcomes-based funding – it rewards increased access • What is new is the shift • From a focus on access • To a focus on student success and other outcomes • A reminder – the importance of tuition and fee revenues to institutions continues to reinforce the importance of access
Students Institutions-Sectors FederalGovernment The Elements of Finance Policy States Philanthropy & Other Sources Operating Support --Outcomes-Based Funding as One Component StudentAid StudentAid Tuition & Fees Scholarships &Waivers Pell& Tax Credits Graduates
Currently in the Third Cycle of Outcomes-Based Funding Round 1 1975 – 1984 Round 2 1985 – 2004 Round 3 2005 - Present
Round 1 • Tennessee breaks new ground • Initially 2%, then 5.4% of each institution’s appropriation tied to performance • Rewards encouraged good practices rather than outcomes • Accreditation of programs • Building data capacity • Using national assessments where available • Etc. • Continued in new model as the Quality Assurance Component
Round 2 Numerous states tried it • California CCs • Florida CCs* • Illinois • Kentucky • Missouri • Ohio • Oklahoma* • Pennsylvania(PASSHE)* • South Carolina • South Dakota • Tennessee* *Still in effect.
Most Faded Away for One or More Reasons • Right idea but faulty implementation • Too complex – too many elements • Insufficient data – unavailable or unreliable • Didn’t recognize different institutional missions – one size fits all • Imposed without institutional consultation/buy-in • Done for the wrong reasons • A resource acquisition device – abandoned when budgets were tight • An end in itself – not a means to promote goal attainment
Round 3 The Current State of Development & Implementation
Different states have constructed their performance funding models to reward production of different combinations of outcomes. But they have one element in common – increasing the number so students who successfully complete a postsecondary program of study. There is every reason for Ohio to follow suit.
Can quibble about the specific goal, but it is hard to argue that Ohio colleges and universities must produce more – many more – college graduates than is currently the case.
Percent of Adults with an Associate Degree or Higher by Age Group – State, U.S. & Leading OECD Countries, 2010 Source: OECD, Education at a Glance 2012, U.S. Census Bureau, 2010 American Community Survey One-Year Public Use Microdata Sample File
Percentage of Jobs in 2018 that Will Require a Postsecondary Education, by State National Average = 63% Source: Georgetown University Center on Education and the Workforce,Projections of Jobs and Education Requirements through 2018; June 2010
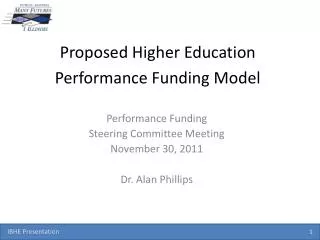
Closing the Gap: Annual Percent Increase in Credential Production Needed to get to 60% by 2025 North Dakota
Observation 1 The completion gap can’t be closed by • Improving high school completion and college participation of recent high school grads to best in the nation levels • Continuing business-as-usual inside higher education
Observation 2 The completion gap won’t be closed even if • High School completion and college participation rates of recent high school graduates are improved to best in nation levels And • Those students graduate from college at rates equal to best in the nation
Observation 3 The completion gap can be fully closed only if a very large number of adults enroll in colleges and complete a postsecondary program of study.
But does outcomes based funding really work? • In most states it is too early to say • But the evidence is starting to trickle in • The evidence suggests that it promotes improvement
Changes from 2011-12 to 2012-13 in the Three-Year Average Funding Formula Data, Community Colleges (THECB)
Changes from 2011-12 to 2012-13 in the Three-Year Average Funding Formula Data, Universities (THECB)
Washington Community Colleges Total Points per College Source: CCRC-IHELP Washington State Student Achievement Initiative: Achievement Points Analysis for Academic years 2007-2011
Ohio Community CollegesChanges in Performance on Student Success Factors, 2009-10
For More Information Contact: Dennis Jones National Center for Higher Education Management Systems dennis@nchems.org303-497-0301 http://www.nchems.org/NCHEMSCLASPOhioModel.swf