Download
1 / 25
250 likes | 338 Views
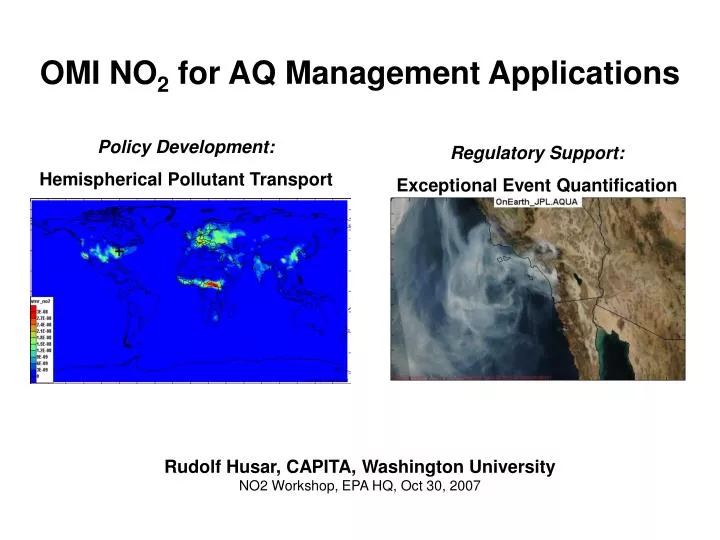
OMI NO 2 for AQ Management Applications. Policy Development: Hemispherical Pollutant Transport. Regulatory Support: Exceptional Event Quantification. Rudolf Husar, CAPITA, Washington University NO2 Workshop, EPA HQ, Oct 30, 2007. Hemispheric Transport of Air Pollutants (HTAP) Data Network:.

E N D
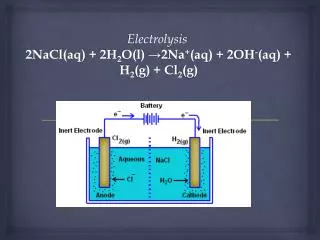
OMI NO2 for AQ Management Applications Policy Development: Hemispherical Pollutant Transport Regulatory Support: Exceptional Event Quantification Rudolf Husar, CAPITA, Washington University NO2 Workshop, EPA HQ, Oct 30, 2007
Hemispheric Transport of Air Pollutants (HTAP)Data Network: Application Examples for NOx Analysis TF HTAP Workshop Forshungszentrum Juelich, Oct 17-19, 2007, Juelich, Germay Collaborators: Rudolf Husar, Washington U. St. Louis Stefan Falke, Northrop, Wash U. Greg Leptoukh, NASA, Goddard Martin Schultz, FZJ, Juelich
2009 HTAP Assessment Model Comparisons Model-model comparison, ensemble, Model Outputs • Seek the reconciliation of models, observations, emissions Emission Integration Emission comparisons, reconciliation Emissions Observations Data Integration Data homogenization and integration
Iterative Air Pollution Analysis Model Comparisons Model-model comparison, ensemble, Forward Modeling Process-based simulation; source-receptor relationship Models Reanalysis Forward model with assimilated observations • In the past, these activities were conducted separately; little mutual support • Iterative linking would characterize the pollutants and create understanding GOAL: Knowledge Creation Characterization of pattern; understating of processes Emission Integration Emission comparisons, reconciliation Emissions Characterization Understanding Model Evaluation Performance testing, improved formulation Inverse Modeling Emissions retrieval from observations; Data Interpretation Use of previous & tacit knowledge to explain data Observations Data Integration Data homogenization and integration
Initial HTAP Data Flow Network Loosely Coupled Data Network of Autonomous Nodes OGC WCS Data Access Protocol
Tropospheric OMI NO2 Average Model Emiss. Obs.
OMI NO2 – Mobil Emissions Model Emiss. Obs.
Tropospheric OMI NO2 Average Model Emiss. Obs.
OMI NO2 – Point Emissions Model Emiss. Obs.
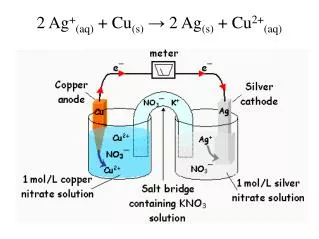
Single Point Sources Model Emiss. Obs. Power Plants
Single Point Sources Model Emiss. Obs.
Georgia Sweetwater Fire Model Emiss. Obs. Sweat Water fire in S. Georgia (May 2007)
Georgia Sweetwater Fire Model Emiss. Obs. Sweat Water fire in S. Georgia (May 2007)
Friday/Sunday Ratio Model Emiss. Obs. Biomass Burning Sunday Smoke
OMI/NEI Emission Ratios Model Emiss. Obs. • Ohio River OMI/Emiss = 1 • Northeast OMI/Emiss = 1.4 US NEI NOx Emission OMI Tropo NO2
Total, Tropospheric, Upper Model Emiss. Obs. Tropo NO2 Total Column NO2 Stratospheric NO2 ????
Model Surface NO2 Model Emiss. Obs. OMI NO2
NOx Data on the Network Emission Aerosol Nitrate Ozone Emission Precipitation Nitrate
Model Model Emiss. Obs. Surface Obs. Diurnal Weekly Seasonal Secular
Exceptional Event Analysis Goal: Understand, quantify AQ impact of Events Approach: • Community, collaboration • ‘Harvesting’, aggregating resources in a wiki workspace • Communal and individual analyses
October 2007 Southern California Fires Smoke Santa Ana Winds Dust Dust
Southern California Fires Oct 21, 2007 Oct 22, 2007 Oct 23, 2007 Oct 24, 2007 • The hi-res OMI data provides columnar NO2 and Aerosol Index • The difference of their spatial pattern indicates smoke age(??) OMI/TOMS - Absorbing Aerosol Index OMI/TOMS – Tropospheric NO2
Consoles are multi-view panels of space-time synchronized data views • On Oct 21, note the burst of smoke, dust between 11 AM and 1:30PM
By Oct 25, the smoke has drifted inland, toward N-NE • The NAAPS model forecasted the smoke, the other models did not
Looking forward networking with you Thank You Models • Collecting EPA - Relevant Data • Performing Iterative Analyses • Characterize and ‘Understand’ NO2 Emissions Observations