Download
1 / 15
160 likes | 298 Views
An Introduction to the Hawaii Ocean Time-series (HOT) program and Station ALOHA. Marine Microplankton Ecology OCN 626. One of the required assignments for OCN 626 is for each of you to give a talk (12 minutes) and write a report on a microbially-relevant aspect of the HOT program.

E N D
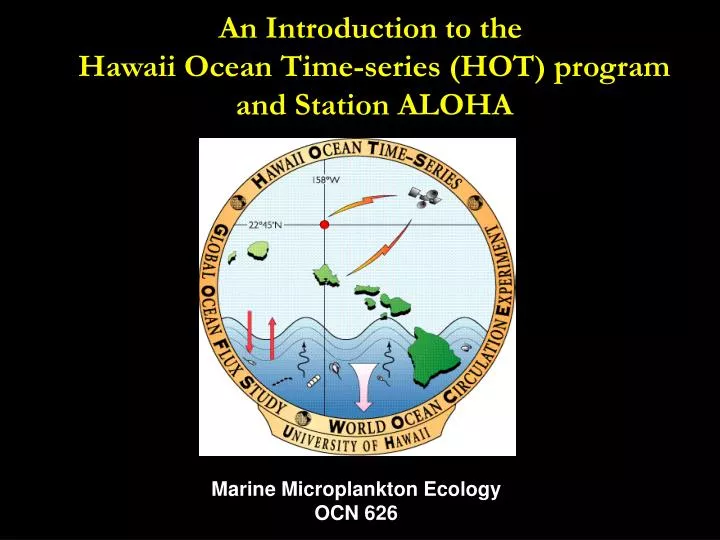
An Introduction to the Hawaii Ocean Time-series (HOT) program and Station ALOHA Marine Microplankton Ecology OCN 626
One of the required assignments for OCN 626 is for each of you to give a talk (12 minutes) and write a report on a microbially-relevant aspect of the HOT program. • Some examples: • Dynamics of primary production • A comparison of plankton biomass at Station ALOHA and at BATS (Sargasso Sea) • Temporal variability in the diversity of photosynthetic plankton
HOT and Station ALOHA • Hawaii Ocean Time series (HOT) began as a central component of the Joint Global Ocean Flux Study in 1988. • Continuous time series record of biogeochemical and physical oceanographic properties at study site Station ALOHA (22°45’N, 158°W) • Station ALOHA is occupied for 1 week every month
Historical Highlights Leading to HOT 1979 Coastal Zone Color Scanner (CZCS) is launched October 1988 First research cruise to Station ALOHA (A Long-term Oligotrophic Habitat Assessment) 1986-1988 Vertical Transport and Exchange (VERTEX) program August 2008 204 Cruises to Station ALOHA 1961 Menzel and Ryther publish 3 years of biogeochemical measurements at Station S 1987 Global Ocean Flux Study begins December 1998 100 cruises to Station ALOHA 1976 Keeling publishes ~18 year record of atmospheric CO2 measurements at Mauna Loa, Hawaii 1988 US National Science Foundation grants to D. Karl (U. Hawaii) and A. Knap (BBSR) for establishment of two deep-ocean time series stations (HOT and BATS) 1954 Stommel and Sutcliffe begin bimonthly measurements at Hydrostation “S” 28 km SE of Bermuda James Watt
Station ALOHA and the North Pacific Subtropical Gyre (NPSG) ALOHA NPSG 15°N to 35°N 135°E to 135°W One of the largest ecosystems on the planet NPSG Station ALOHA 4800 m deep
HOT BATS
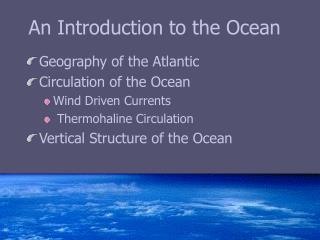
Characteristic features of the subtropical gyre habitats • Very low nutrient concentrations • Light penetrates deep into the upper ocean • Deep chlorophyll maximum • Small plankton • Very rapid nutrient recycling • Very important to global carbon cycle (by virtue of their enormous size)
Objectives of the HOT program (circa 1996) • Understand seasonal and interannual variability in rates of production and particle export. • Determine the mechanisms and rates of nutrient input and recycling in the upper 200 m of the water column. • Measure time varying concentrations of CO2 in the upper ocean and estimate annual air-sea gas fluxes
HOT Program Highlights(specific to marine microbiology) • Bacteria are predominate photosynthetic organisms (Prochlorococcus and Synechococcus). • Climate-dependence to plankton biomass and productivity. • Higher than anticipated rates of primary production (> 14 mol C m-2 yr-1). • Archaea numerically dominate mesopelagic (> 200 m) plankton assemblages.
HOT-DOGS • Data Types • CTD: Seabird sensor package • Bottle: 24-place rossette and 12L niskin bottles • Particle Flux: floating sediment traps • Primary Production : in-situ incubated 14C • Data Modules • Data Extraction: text columns of data • Display: vertical profiles • Standard Depths: summary & comparative plots • Time-Series: integral, means & horizons
Partial list of microbially-relevant measurements at Station ALOHA • Temperature, Salinity, Density • dissolved O2, dissolved inorganic carbon, pH • Dissolved inorganic nutrients (nitrate, nitrite, phosphorus, silica) • Particulate nitrogen, carbon, and phosphorus • Pigments • Primary production • Various measures of plankton biomass • Plankton cell abundances (Prochlorococcus, Synechococcus, non-pigmented picoplankton). • Particle export (carbon, nitrogen, phosphorus fluxes)
A few ideas for topics… • “Variability in primary production at Station ALOHA” • Data sets available: 14C-bicarbonate assimilation rates, changes in O2 • “A comparison of plankton biomass and productivity at Station ALOHA and BATS” • Data sets available: bacterial cell abundances, chlorophyll, primary production, etc. • “Temporal variability in the diversity and biomass of photosynthetic plankton” • Data sets available: HPLC pigment concentrations, flow cytometric cell abundances