Download
1 / 24
240 likes | 407 Views
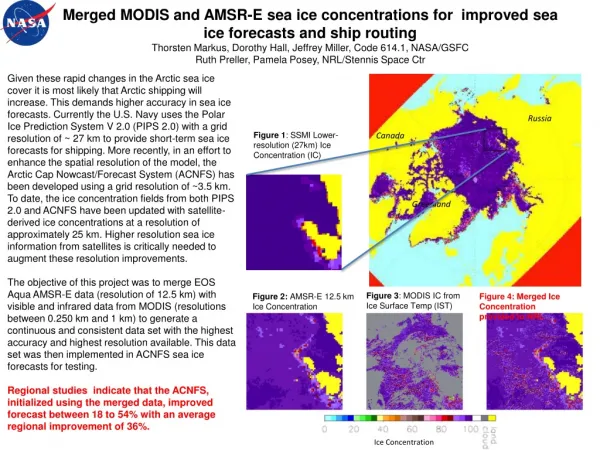
AMSR-E and Enhanced Resolution SSM/I Sea Ice Drift. Walt Meier AMSR Science Team Meeting, 15 July 2008. Enhanced Resolution SSM/I Brightness Temperatures. Uses BYU SIRF algorithm (D. Long et al.) Image reconstruction – not simply spatial interpolation

E N D
AMSR-E and Enhanced Resolution SSM/I Sea Ice Drift Walt Meier AMSR Science Team Meeting, 15 July 2008
Enhanced Resolution SSM/I Brightness Temperatures • Uses BYU SIRF algorithm (D. Long et al.) • Image reconstruction – not simply spatial interpolation • Daily fields of 36-hour composites, 1995 – 2006 • Limited to poleward of 60º N in Arctic – misses significant winter sea ice • 19, 22, 37 GHz at 8.9 km grid spacing • 85 GHz at 4.45 km grid spacing • Research-level product, needs to be validated • Not publicly available, but researchers interested in testing are encouraged • contact: walt@nsidc.org or stroeve@nsidc.org 85V GHz 15 Mar 2004
Sea Ice Drift Algorithm • Maximum cross-correlation method – feature matching in coincident, geo-located imagery (C. Fowler et al., Univ. of Colorado) • Potentially affected by weather, especially 89 GHz – filtering done to remove most of these effects • Optimal interpolation of 36/37 GHz and 89/85 GHz drift in final products • Limited performance during summer, especially during peak of melt season (July -August) • 18 GHz performs better for AMSR (Kwok, 2008); resolution too low for SSM/I
Daily Motion, 1 Mar 2004 U 10 km day-1 V AMSR SSM/I
Weekly Sea Ice Drift, Jan – May 2004 AMSR SSM/I
Comparison with IABP Buoys – Daily Drift Non-enhanced SSM/I RMS = ~4-5 km day-1
Application of Sea Ice Motions • SSM/I, AVHRR, and buoy motion • Lagrangian tracking of ice parcels by age • Average thickness for each age class • Developed by Maslanik and Fowler, Univ. of Colorado March Thickness Image from Stroeve et al., 2008
Application of Sea Ice Motions Image courtesy S. Drobot and J. Maslanik, Univ. of Colorado
AMSR 2007 Melt Season Sea Ice Drift, Apr - Sep • Strong poleward drift at end of summer contributed to extreme minimum • AMSR motions limited during peak of melt season (late July, August) • Still capture most of weekly variability • 18 GHz channel performs better (Kwok, 2008)
AMSR 2008 Sea Ice Drift, January - June • Poleward drift in Feb/Mar pushed perennial ice northward from Siberian sector • Perennial ice fraction in central Arctic decreased through winter
2008 Sea Ice Conditions • NSIDC Arctic News and Analysis • Partially funded by NASA • Primarily SMMR-SSM/I for long-term trend and variability • AMSR provides much better spatial detail on conditions • AMSR has smaller pole hole – will North Pole be ice-free this summer? http://nsidc.org/arcticseaicenews/
2008 Arctic Sea Ice Conditions, 14 July Daily Sea Ice Extent From SSM/I F15 SSM/I F15 25 km Sea Ice Concentration
2008 Arctic Sea Ice Conditions, 14 July Daily Sea Ice Extent From SSM/I F15 AMSR 6.25 km Sea Ice Concentration AMSR image from Univ. Bremen, http://www.iup.uni-bremen.de:8084/amsr/amsre.html
2008 vs. 2007 Summer Set-Up from AMSR 14 July 2007 14 July 2008 AMSR image from Univ. Bremen, http://www.iup.uni-bremen.de:8084/amsr/amsre.html
Conclusion • Enhanced resolution SSM/I provides sea ice drift of comparable quality to AMSR • Extended timeseries of high-resolution passive microwave drift • Potential for combined product? • D. Long et al. at BYU has developed enhanced fields from AMSR-E Tbs
Thanks! • Research funded by NASA Grant #NNG04GG72A • Enhanced resolution SSM/I data provided by David Long and NASA-funded BYU Scatterometer Climate Record Pathfinder • Thanks to Julienne Stroeve, Jeff Smith, Terry Haran, NSIDC walt@nsidc.org
Standardized sea ice trends Extent Anomaly (# st. dev. From 1979-2000 mean) Arctic 12-month running mean Antarctic 12-month running mean Year
Antarctic trend magnitude and significance >+7 +3 to +7 +0 to +3 No Variability -0 to -3 -3 to -7 <-7 <95 95 99 99.9 %/decade trend Significance Level Significance based on f-test with null hypothesis of no trend
Arctic trend magnitude and significance >+7 +3 to +7 +0 to +3 No Variability -0 to -3 -3 to -7 <-7 <95 95 99 99.9 %/decade trend Significance Level Significance based on f-test with null hypothesis of no trend No variability = always 0% or 100% ice throughout region during the month
Regional analysis of sea ice extent trends 15 Arctic Regions 5 Antarctic Regions Okhotsk Weddell Indian Bering E. Sib Laptev Chukchi Kara Central Arctic Beaufort Bellingshausen- Amundsen Barents Canadian Archipelago Baffin Hudson Greenland Ross Pacific St. Lawrence Regions adapted from Parkinson et al. (1999) and Zwally et al. (2002), JGR
References • Haarpaintner, J., and G. Spreen, 2007. Use of enhanced-resolution QuikScat/SeaWinds data for operational ice services and climate research: Sea ice edge, type, concentration, and drift, IEEE Trans. Geosci. Rem. Sens., 45(10), 3131-3137. • Kwok, R., 2008. Summer sea ice motion from the 18 GHz channel of AMSR-E and the exchange of sea ice between the Pacific and Atlantic sectors, Geophys. Res. Lett., 35, L03504, doi:10.1029/2007GL032692 • Long, D.G., P.J. Hardin, and P.T. Whiting, 1993. Resolution enhancement of spaceborne scatterometer data, IEEE Trans. Geosci. Rem. Sens., 31(3), 700-715. • Long, D.G., and D.L. Dunn, 1998. Spatial resolution enhancement of SSM/I data, IEEE Trans. Geosci. Rem. Sens., 36(2), 407-417. • Meier, W.N., and T. Vermeychuk, 2003. Sea ice motions from microwave imagery, Amer. Meteorol. Soc. 7th Conf. on Polar Meteorol. and Oceanogr., Hyannis, MA, 12-16 May. • Meier, W.N., 2005. Comparison of passive microwave concentration algorithm retrievals with AVHRR imagery in Arctic peripheral seas, IEEE Trans. Geosci. Rem. Sens., 43(6), 1324-1337. • Remund, Q.P., and D.G. Long, 1999. Sea ice extent mapping using Ku band scatterometer data, J. Geophys. Res., 104(C5), 11,515-11,527. • Stroeve, J., S. Drobot, S. Gearheard, T. Scambos, M. Serreze, J. Maslanik, W. Meier, M. Holland, 2008. Arctic sea ice plummets in 2007, Eos Trans. AGU, 89(2), 13, doi: 10.1029/2008EO020001.