Download
1 / 1
10 likes | 100 Views
Graduate Category: Engineering and Technology Degree Level: Ph.D. Abstract ID# 122. On-Chip Spectral Analysis for Built-In Testing and Digital Calibration of Analog Integrated Circuits Hari Chauhan, Yongsuk Choi, In-Seok Jung, Faculty Advisors: Marvin Onabajo, Yong-Bin Kim. Introduction.

E N D
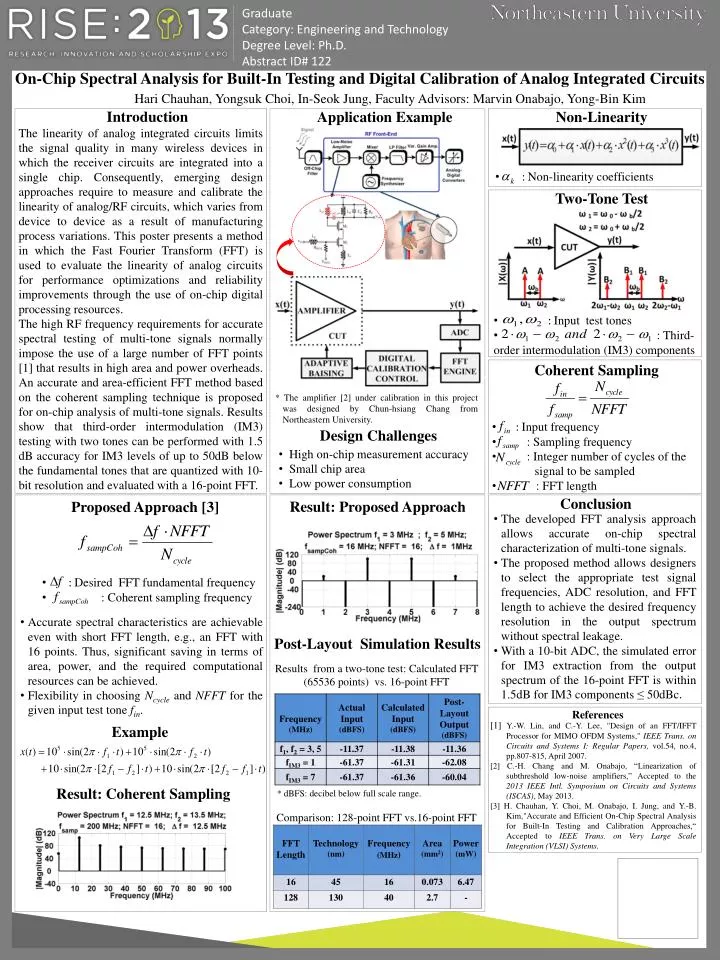
Graduate Category: Engineering and Technology Degree Level: Ph.D. Abstract ID# 122 On-Chip Spectral Analysis for Built-In Testing and Digital Calibration of Analog Integrated Circuits Hari Chauhan, Yongsuk Choi, In-Seok Jung, Faculty Advisors: Marvin Onabajo, Yong-Bin Kim Introduction Application Example Non-Linearity The linearity of analog integrated circuits limits the signal quality in many wireless devices in which the receiver circuits are integrated into a single chip. Consequently, emerging design approaches require to measure and calibrate the linearity of analog/RF circuits, which varies from device to device as a result of manufacturing process variations. This poster presents a method in which the Fast Fourier Transform (FFT) is used to evaluate the linearity of analog circuits for performance optimizations and reliability improvements through the use of on-chip digital processing resources. The high RF frequency requirements for accurate spectral testing of multi-tone signals normally impose the use of a large number of FFT points [1] that results in high area and power overheads. An accurate and area-efficient FFT method based on the coherent sampling technique is proposed for on-chip analysis of multi-tone signals. Results show that third-order intermodulation (IM3) testing with two tones can be performed with 1.5 dB accuracy for IM3 levels of up to 50dB below the fundamental tones that are quantized with 10-bit resolution and evaluated with a 16-point FFT. • : Non-linearity coefficients Two-Tone Test • : Input test tones • : Third-order intermodulation (IM3) components Coherent Sampling * The amplifier [2] under calibration in this project was designed by Chun-hsiang Chang from Northeastern University. • : Input frequency • : Sampling frequency • : Integer number of cycles of the • signal to be sampled • : FFT length Design Challenges • High on-chip measurement accuracy • Small chip area • Low power consumption Result: Proposed Approach Conclusion Proposed Approach [3] • The developed FFT analysis approach allows accurate on-chip spectral characterization of multi-tone signals. • The proposed method allows designers to select the appropriate test signal frequencies, ADC resolution, and FFT length to achieve the desired frequency resolution in the output spectrum without spectral leakage. • With a 10-bit ADC, the simulated error for IM3 extraction from the output spectrum of the 16-point FFT is within 1.5dB for IM3 components ≤ 50dBc. • : Desired FFT fundamental frequency • : Coherent sampling frequency • Accurate spectral characteristics are achievable even with short FFT length, e.g., an FFT with 16 points. Thus, significant saving in terms of area, power, and the required computational resources can be achieved. • Flexibility in choosing Ncycle and NFFT for the given input test tone fin. Post-Layout Simulation Results Results from a two-tone test: Calculated FFT (65536 points) vs. 16-point FFT Example References [1] Y.-W. Lin, and C.-Y. Lee, "Design of an FFT/IFFT Processor for MIMO OFDM Systems," IEEE Trans. onCircuits and Systems I: Regular Papers, vol.54, no.4, pp.807-815, April 2007. [2] C.-H. Chang and M. Onabajo, “Linearization of subthreshold low-noise amplifiers,” Accepted to the 2013 IEEE Intl. Symposium on Circuits and Systems (ISCAS), May 2013. [3] H. Chauhan, Y. Choi, M. Onabajo, I. Jung, and Y.-B. Kim,"Accurate and Efficient On-Chip Spectral Analysis for Built-In Testing and Calibration Approaches,“ Accepted to IEEE Trans. on Very Large Scale Integration (VLSI) Systems. Result: Coherent Sampling * dBFS: decibel below full scale range. Comparison: 128-point FFT vs.16-point FFT