Download
1 / 26
260 likes | 342 Views
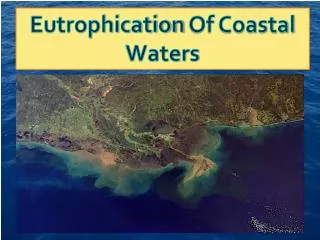
Nutrient Determination in the Belgian Coastal Waters of the North Sea. By Sheku Sei and Enyue Xue 1 st Year Ecomama. Content. Introduction Sampling Site Materials and Methods Result Discussion Conclusion. Introduction.

E N D
Nutrient Determination in the Belgian Coastal Waters of the North Sea By Sheku Sei and Enyue Xue 1st Year Ecomama
Content Introduction Sampling Site Materials and Methods Result Discussion Conclusion
Introduction • The North Sea - situated on the continental shelf of northwest Europe. • TheBelgian part of the North Sea – • 3,600 km², which is about the size of West Flanders. about half a per cent of the surface of the North Sea.
Introduction • The basis of the practicals • To quantify nutrient concentration from sea water samples collected at different stations and different depths • To obtain an insight into nutrient variability • learn Practical techniques how and seasonal variations
Introduction • Nutrients - important for primary production in the sea • A limiting factor :light+low nutrient=low pp • Concentrations- usually high in winter- why? • High mixing processes • High nutrient + light =high pp • Light limiting factor High nutrient consumption at surface waters
Method and materials • Sampling- survey cruise : Research vessel ZEELEEUW • Sampling along the Belgian Continental Shelf • Sea water –collected –by Niskin Bottles • Samples filtered in polyethylene bottles and deep frozen • Analysis done using the standard protocols of reagents • Equipment: spectrophotometer - absorbance • Calibration done using different dilutions to generate calibration curve –useful to determine concentrations (Con. (ug/l =corrected extinction –b)/a • Ammonium determined immediately
Phosphate Concentration in Samples MeanConc. (ug/l) Depth (m) Conc. (ug/l) Depth (m) Conc. (ug/l) Depth (m) 44.0627 SD:4 .268 3 46.4555 SD: 3.3165 3 40.5367 SD:1.007 3 44.556 SD: 3.828 10 41.9005 SD: 0.0493 10 40.868 SD:0 .681 10 44.995 SD: 4.102 20 40.02 SD: 0.682 20 Station 230Station 330Station 435
Conc.(ug/l) Conc. (ug/l) Depth(m) Depth(m) 27.705 SD: 3.5260 3 Conc.(ug/l) Depth(m) 22.259 SD: .606 3 29.826 SD: 5.137 3 22.898 SD: 2.4045 10 23.308 SD:0.9390 10 26.3815 SD:0 .01 10 29.459 SD:7.071 20 22.193 SD: 0.614 20 Silicate Concentration in Samples Station 230 Station 330 Station 435
Station Mean Concentrations(ug/l) Lagoon 84.2222 SD: 1.398 230 19.870 SD:4.243 330 60.611 SD: 33.793 435 27.741 SD:3.539 1Nb 30.056 SD: 0.278 2Nb1 32.833 SD: 1.690 Nbii 24.500 SD: 1.470 3Nb2 Ammonium Concentration at Various Stations
Vertical profiles Phosphate Conc.(ug/l) 20 60 40 3 330-P 10 S 435P D(m) S 230-P 20
Vertical profiles- Silicate Conc. (ug/l) 40 60 20 3 330 D(m) 230 10 435 20
DATA ANALYSIS Hypothesis • The Waters of the North Sea has water characteristics as that of the Atlantic Ocean. Since the Southern bight of the North Sea is part of the Atlantic Ocean, the hypothesis is that during winter, nutrient concentrations at different depths don’t vary much with depth • Null Hypothesis (H0) = Mean nutrient concentrations don’t vary significantly with depth and at different stations. • Alternative Hypothesis(H1) =Mean concentrations vary with depth and at different stations.
DATA ANALYSIS- phosphate • We test the difference of two means, assuming the concentrations are all normal and testing at the level of significance of 5% for stations 330 at 3m and 10m: H0: µ2 - µ1 = 0, H1: µ2 - µ1 < 0 N1 = Number of samples for X = 3 • N2 = Number of samples for = 3 • Critical point at 5% confidence interval = - 1.645 • Y– X - (µ1 -µ2)H0 • = 0.1490 > - 1.645 we cannot reject H0 • √s12/n1 + s22 /n2 Hence nutrient concentrations at the two depths do not vary significantly
DATA ANALYSIS • 2. Station 330-3m and station 330- 20m • Calculated = 0.7032, which is > -1.645, we cannot reject H0. Thus nutrient concentrations at this depth do not differ greatly • 3. Station 330 –3m and 230 –3m • Calculated = 0.7032, is greater than critical p value. We cannot reject the null hypothesis. Hence nutrient concentrations at these stations do not differ significantly • 4. Station 330 –10m and 435 -10m. • Calculated = -1.630, which is greater than the critical point. We cannot reject null hypothesis
DATA ANALYSIS- silicate • Station 330 –3m and station 330 –10m • Calculated test value = - 1.6845 < - 1.645, we reject H0 the concentrations differ. • Station 330 –3m and 330-20m • Calculated test value = 0.3197 > -1.645, we cannot reject Null. The concentrations at this depth do not differ greatly • Station 330- 10m and station 330-20m • Calculated = 1.2644 > - 1.645, we cannot reject Null, the concentrations of silicate do not differ greatly at these depths.
DATA ANALYSIS • Station 330- 3m and 230- 3m • Calculated test value = - 0.4814 > -1.645, we cannot reject Null, the concentrations at these stations do not differ greatly • Station 330-10m and 435 –10m • Calculated test value = 0.2751 > –1.645, we cannot reject H0, the concentrations of silicate do not vary greatly at this depth. • Station 230 -3m and 435- 3m • Calculated test value = - 2.0732 < - 1.645, we reject null hypothesis, and say that the concentrations differ at these stations.
DISCUSSION • From the vertical profiles and from the statistical tests, we see that the nutrient concentrations do not vary greatly with depth though there are some variations in the silicate concentrations for instance at stations 330 and 435 at 3m depth, and that also at stations 330-3m and 330 10 m • The concentrations of phosphate is high due to the fact during the period we sampled, there was not much productivity of plankton. Though there were lots of nutrients and mixing, light was limited during that period hence light will be a limiting factor for primary production though there is enough nutrient.
Discussion 2 • well mixed water column and high nutrient concentrations, in the photic zone. The concentrations slightly low at the surface at station 330 • and high at the bottom. At station 435, the concentrations are a bit higher at the surface and low at the bottom. • Silicate concentrations are also slightly high at the bottom depth. • Such fluctuations may be due to the slower process of consumption by phytoplankton at a very low rate though sunlight is light is limited.
Discussion 3 • The concentration of ammonium is very high in the Spuikom lagoon. • May be due to waste disposal in to the lagoon • Ammonium not taken up by phytoplankton • Excretion processes of zooplankton • The high concentration of ammonium at the different stations, Nb stations and stations 230, 330, 435, are all as a result of the fact that enormous quantity of ammonium is discharged in to the sea from rivers from industrial and agricultural sources, from estuaries like the Scheldt.
CONCLUSION • The trend of vertical distribution of silicate and phosphate are similar at station 435 and 230, • low concentrations at the surface and high at mid depth and bottom, at station 330 the fluctuation also vary with high concentration at the surface and low at mid depth. • These are due to the mixing of the water column and the fluctuations in the photosynthetic activities, which is dependent on as when light is available.
CONCLUSION • High mixing takes place, the bottom is close to isothermal. Where nutrient concentrations are low it is due to the utilization by during photosynthesis • Seasonal changes in nutrient concentration most evident in the temperate area. • expected productivity - higher during spring - enough light, enough nutrient- diatom bloom in the North Sea. • The period of study was faced with light limitation.
Danke Zier Gut!