Download

1 / 26
280 likes | 561 Views
WIND TUNNEL SIMULATION OF WAKE EFFECTS ON WIND TURBINE PERFORMANCE. M. S. Adaramola and P-Å Krogstad Department of Energy and Process Engineering, The Norwegian University of Science and Technology, N-7491 Trondheim, Norway. OUTLINES. Introduction Objectives Experimental set-up Results

E N D
WIND TUNNEL SIMULATION OF WAKE EFFECTS ON WIND TURBINE PERFORMANCE M. S. Adaramola and P-Å Krogstad Department of Energy and Process Engineering, The Norwegian University of Science and Technology, N-7491 Trondheim, Norway
OUTLINES Introduction Objectives Experimental set-up Results Conclusions
Wind conditions Turbine wake
Performance characteristics Wind conditions Turbine wake
Performance characteristics Wind conditions Turbine wake Site topology/ surface roughness
Performance characteristics Wind conditions Turbine wake Site topology/ surface roughness Downstream turbine performance depends on these parameters as well as distance from the upstream turbine.
Effect of distance of separation between the turbines, S/D. • Effect of power extracted from the upstream • turbine, i.e. function of tip speed ratio,
Effect of distance of separation between the turbines, S/D. • Effect of power extracted from the upstream • turbine, i.e. function of tip speed ratio, • 3.Effect of downstream turbine pitch angle, β.
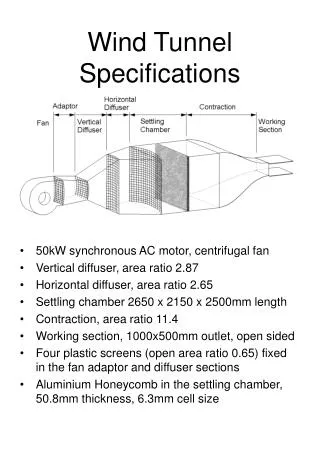
Wind tunnel Dimensions: • Height – 1.9 m • Width – 2.7 m • Length – 12 m • Blockage ratio:12.4% • Wind velocity:11.5 m/s
Gap between turbines: • S/D = 3, 6, 9 • Downstream turbine: • β = -2o, 0o, 2o • Upstream turbine operating conditions: • Optimum • Low, optimum and high
Relative max. Cp when downstream turbine blade pitch setting is β = 2o
Effect of downstream turbine blade pitch setting (β ) for S/D = 3
Relative max. Cp as function of upstream turbine Downstream turbine at S/D = 3
1. The turbines should be operated at different blade pitch angles.
1. The turbines should be operated at different blade pitch angles. 2. Operating the upstream turbine slightly outside its optimum will increase the performance of the turbines further downstream.
1. The turbines should be operated at different blade pitch angles. 2. Operating the upstream turbine slightly outside its optimum will increase the performance of the turbines further downstream. 3. Increase in the downstream turbine power production may improve the overall wind farm performance.