Download
1 / 37
380 likes | 618 Views
Jerry Keesee, Director of the Informix lab Dan Wood, IDS Architect. Advanced Performance Tuning and Monitoring of the IBM Informix Dynamic Server. Advanced Performance Tuning and Monitoring of the IBM Informix Dynamic Server. Main Topics. Establishing a Base Line Deciding What to Capture

E N D
Jerry Keesee, Director of the Informix lab Dan Wood, IDS Architect Advanced Performance Tuning and Monitoring of the IBM Informix Dynamic Server
Advanced Performance Tuning and Monitoring of the IBM Informix Dynamic Server
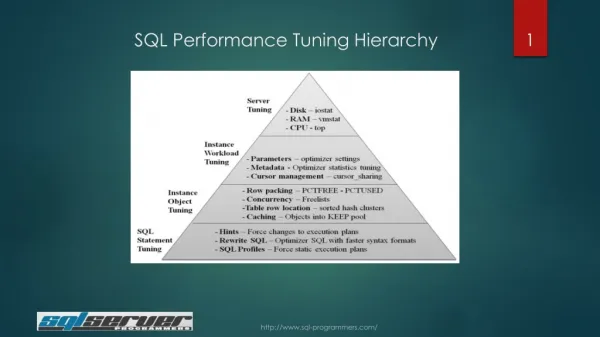
Main Topics • Establishing a Base Line • Deciding What to Capture • Analysis of Performance Data • Resolutions Derived from Data
Know Thyself! • Oracle at Delphi 873 B.C.
Create a Performance Database • Periodically capture key information • Include information from engine • onstat –p, onstat –g iof, etc. • Sysmaster database • Include information from the OS • sar, iostat, vmstat, mpstat, etc • Be sure to run ‘onstat –z’ after capturing database information
Run periodically onstat sysmaster sar iostat Analysis Creating a Base Line Capture information now. Try to have several weeks of data before you need it so that trends and cycles can be understood. Capture The capture script could be a simple dbaccess script, the execution of a stored procedure, or awk/perl
OS capture • At a minimum you need disk IO/sec and processor utilization • sar –u • vmstat • iostat • Consider capture of paging and memory usage
Number of times we had to waiton a buffer in the buffer pool. This can indicate that a singlepage is being altered too much. Also this can occur if the pageis being flushed to disk too often (LRU_MIN set to 0) Number of times lock request issued on a locked table/page/row. If ratio between lokwaits/lockreqsis too high, then applications maybe single-threading. Number of times a request wasmade for a buffer and nonewas available. Indicates eithertoo small of a buffer pool ortoo many dirty pages in the buffer pool If ratio between seqscansand isamtot is greater than 1%, then we might wantto check index usage. Percentage of reads from shared memory relative to disk reads. For OLTP system should be above 98 %. Indicator of too few buffers in system. Ratio between buffer reads and buffer writes. Normally for OLTP systems this is about 10:1, that is 10 reads for every write. This gives an indication as to whether emphasis should be placed on chunk IO or on keeping the buffers fairly clean. But as in all cases, the ratio between buffer reads and buffer writes will varybased on your normal system usage. Know Thyself!!! Number of table/page/rowlocks that have been raised. Ratio between rollback and commits. If too high (> 1%) then application is probably not designed correctly. Need to examine why so many rollbacks and take corrective action. onstat -p dskreads pagreads bufreads %cached dskwrits pagwrits bufwrits %cached 1083 1653 193884 99.44 3860 14583 59454 93.51 isamtot open start read write rewrite delete commit rollbk 139364 21933 22499 36438 16624 1747 1445 1160 0 gp_read gp_write gp_rewrt gp_del gp_alloc gp_free gp_curs 41 15 147 0 4 0 4 ovlock ovuserthread ovbuff usercpu syscpu numckpts flushes 0 0 0 24.07 2.87 7 17 bufwaits lokwaits lockreqs deadlks dltouts ckpwaits compress seqscans 0 1 54737 0 0 4 1623 690 ixda-RA idx-RA da-RA RA-pgsused lchwaits 0 0 0 0 349 Above all – learn what is normal for yoursystem before attempting to make anychanges.
Examine chunks with highactivity. Consider splitting data on those chunks. If the total number of IO for a single device exceeds 8/sec,consider moving some data off. Avoid having twochunks on the same device onstat -D Dbspaces address number flags fchunk nchunks flags owner name ad067d8 1 0x20001 1 1 N informix rootdbs b4ad870 2 0x28001 2 1 N S informix sbsp1 b4d9720 3 0x28001 3 1 N S informix sbindex b4ec880 4 0x28001 4 1 N S informix sbsp2 b4ed9e0 5 0x28001 5 1 N S informix sbspace 5 active, 2047 maximum Chunks address chunk/dbs offset page Rd page Wr pathname ad06928 1 1 0 1621 15163 /work/mpruet/db/Chunk1 b4ad9c0 2 2 0 254 18 /work/mpruet/db/Chunk2 b4d9870 3 3 0 73 32 /work/mpruet/db/Chunk3 b4ec9d0 4 4 0 352 342 /work/mpruet/db/Chunk4 b4edb30 5 5 188000 243 233 /work/mpruet/db/Chunk1 5 active, 2047 maximum Expanded chunk capacity mode: disabled
Need to consider movingdata from this chunk. It is starting to get too much activity. If it is only onetable, then consider fragmentation of that table. Generic File Descriptor – an internal number thatis used to identify the chunk across all virtual processors. onstat –g iof AIO global files: gfd pathname totalops dskread dskwrite io/s 3 RootChunk 11771 8723 3049 3.27 4 Chunk1 25341 25341 4611 8.32 5 Chunk2 12420 5436 6984 3.45 6 SBChunk 1260 1120 140 0.35 7 Chunk3 108 107 1 0.03
Writes done as part of a checkpoint Writes done between checkpoints. Foreground Writes – page flush requestedby user thread - If this is ever not zerothen buffer pool is too dirty. LRU_MIN/LRU_MAX, BUFFERS and/or CKPTINTVL need adjusting. onstat -F Fg Writes LRU Writes Chunk Writes 0 24 2829 address flusher state data add461c 0 I 0 = 0X0 states: Exit Idle Chunk Lru
In general numbers here indicate that the application may need some work. Check for ‘hot rows’, going against the same data in opposite directions, etc. Buffer Read Hit Ratio – Ratio of buffer reads thatdid not require a physicaldisk read In general numbers here indicatethat we might want to check to seeif adding an index would be in order Lock Requests Times thread was put on wait for a lock Number of times that a lock timed out Number of deadlocks encountered while waiting on a lock. Number of sequential scansissued against the partition Partition number of table/fragment Can be used to determine which tables/fragments tend to have the most activity. onstat –g ppf Partition profiles partnum lkrqs lkwts dlks touts isrd iswrt isrwt isdel bfrd bfwrt seqsc rhitratio 0x100123 8698 0 0 0 3163 243 242 62 12209 1219 3 100 0x100124 4660 322 31 53 6553 3797 148 964 41278 11832 0 100 0x100125 1366 0 0 0 652 210 148 62 3850 1138 1 100 0x100126 1015 0 0 0 65 306 0 111 5330 1410 1 100 0x100127 771 0 0 0 251 110 0 0 1390 380 0 100 0x100128 506 0 0 0 72 357 0 0 1207 778 0 100 0x100129 534 0 0 0 940 0 0 1750 12 359 67 N.B. Available from sysmaster (sysptprof) May require setting TBLSPACE_STATS 1in onconfig file.
Sysmaster syssqexplain table • Contains information about statements currently open and prepared statements • Can be used to find queries that are requiring sorts, temporary tables, sequential scans, etc • Includes actual query statement • Can aid in finding problem queries
Number of times the statement has been executed Total time execution of statementhas encountered Statistics about statement. Max disk space needed for sort The first part of the outputis actual costs that the statementhas already encountered. Select * from syssqexplain; sqx_sessionid 23 sqx_sdbno 0 sqx_iscurrent Y sqx_executions 4 sqx_cumtime 0.21 sqx_bufreads 21 sqx_pagereads 4 sqx_bufwrites 0 sqx_pagewrites 0 sqx_totsorts 4 sqx_dsksorts 0 sqx_sortspmax 0 sqx_conbno 0 sqx_ismain Y
Optimizer Cost Number Sequential Scans Number Sort Scans Number of Auto Indexes Number of Remote Queries Required Number of Temp Files Number of Temp Views The second part contains information about the query plan Pay close attention to queries thatrequire an auto index, temp files,and sequential scans. Select * from syssqexplain; sqx_selflag SQ_SELECT sqx_estcost 654 sqx_estrows 200 sqx_seqscan 2 sqx_srtscan 0 sqx_autoindex 0 sqx_index 0 sqx_remsql 0 sqx_mrgjoin 0 sqx_dynhashjoin 0 sqx_keyonly 0 sqx_tempfile 1 sqx_tempview 0 sqx_softheads 0 sqx_sqlstatement select * from account, transactions where account.acct_id = transactions.account_id order by tran_amount sqx_seqscan sqx_autoindex sqx_tempfile Actual Query
General Guidelines • Run update statistics • Do not skimp on memory • Try to avoid running client and server on the same machine • Allocate fewer larger memory segments rather than many smaller • Try to avoid having too much disk capacity on a limited number of controllers • Learn the characteristics of your system
Ways to Avoid Long Rows • Avoid having rows larger than the page size • Consider separating columns that you filter on from columns that you don’t and then join • Consider using CLOBS for variable length columns • Avoid updating varchar columns
Onconfig Parameters • NUMCPUVPS – The endless debate. • Given enough physical processors performance will peak out between 16 to 32 CPU VP’s but you need to not use all the physical processors for CPU VP’s. • On a small box; <= 4 CPU’s, you might use all 4 CPU’s for CPU VP’s. • On a larger box; > 4 CPU’s, you might use 5 CPU VP’s per 6 CPU’s. • However, there are many factors which can affect this. • Are there many client processes running on the same box? • Are you using NET VP’s for the poll threads handling many connections? • Have you disabled KAIO and configured many AIO VP’s. • The only real rule is to add CPU VPs until it no longer provides any improvement.
Onconfig Parameters • RESIDENT • Set to 1. Or 2 if you have enough memory. This makes a big performance difference on big Sun boxes. • NOAGE • Set to 1 • Processor Affinity (AFF_SPROC/AFF_NPROCS) • Turn on if engine is only thing running on the machine
Onconfig Parameters • CLEANERS • < 20 disks – set to 1 per disk • 20 - 100 disks – set to 1 for every other disk • > 100 disks - set to 1 for every four disks • Striping and RAID-5 • Cut number of cleaners down by 1/3
Onconfig Parameters • LRU • Set to max of 128. 512 on 64-bit platforms • LRU_MIN/LRU_MAX • Avoid setting LRU_MIN to 0 as it can cause additional buffer waits • 1 and 2 in most large memory OLTP systems – higher values for DSS systems. In 9.4 you can set these to float values like “.2”. This is useful when 1% of a huge buffer pool is large causing slow checkpoints.
Onconfig Parameters • Read Ahead • RA_PAGES • Number of pages to read ahead when scanning • 32-64 • Too large a value can cause additional buff waits and/or block the IO channel. • RA_THRESHOLD • Point where next big buffer read is triggered
Onconfig Parameters • PHYSDBS and DBSPACE for logs • Place both of these on separate dedicated fast disks • DBSPACETEMP • Locations for temporary tables and sort space • Place on separate devices
Onconfig Parameters • OPTCOMPIND • 0 – give preference to nested loop join (OLTP) • DIRECTIVES • 1 – turn on optimizer directives
Environment Variables • PSORT_NPROCS • Number of threads that the server can use to perform a parallel sort • Should be no greater than number of CPUVPS
Environment Variables • IFX_NETBUF_SIZE • Can be used to increase the network buffer size from the default 4K • Useful if doing large loads or blob work
PDQ/Fragmentation • Consider fragmenting any large table in a dbspace that is getting a lot of IO activity • Consider fragmenting any large table if scans must be done against the table • Do not put multiple fragments of the same table on the same physical device • Avoid using round robin fragmentation for indexes. • Do not over-fragment. • The cost of managing fragmentation can outweigh the benefits when there are excessive fragments.
Typical Query Send to client Sort Join Scan
Typical Query with PDQ Sort Sort Send to client Join Scan Scan Scan
PDQ Configuration • MAX_PDQPRIORITY • Set highest percentage of PDQ resources that a single client can use • DS_MAX_QUERIES • Max number of DSS queries that can be run together • DS_TOTAL_MEMORY • Total memory reserved for PDQ • DS_MAX_SCANS • Max number of parallel scans allowed. Leave at default (1048567)
PDQ Configuration • If the site is primary a DSS system, then it is recommended that most of the allocated memory be in the virtual buffers and that DS_TOTAL_MEMORY be very large • PDQ can be used in smaller memory environments by setting PDQ_PRIORITY to 1 so that parallel scans can be done.
PDQ Configuration • onmode can be used to dynamically change PDQ parameters • onmode –M (DS_TOTAL_MEMORY) • onmode –Q (DS_MAX_QUERIES) • onmode –D (MAX_PDQPRIORITY) • onmode –S (DS_MAX_SCANS) • It is not recommended to try to do DSS queries at the same time that the system is doing OLTP
Next Chat with the Lab Informix on Linux – Wednesday, December 1, 2004 11:00 a.m. Eastern, 10:00 a.m. Central, 9:00 a.m. Mountain, 8:00 a.m. Pacific What a story we have to tell! Informix was there at the start, IBM loves Linux and Microsoft looks nervous! We speak Linux and we’re packing a lot into this session. Join us to hear about where IBM is headed with Linux, Informix products on Linux, maximizing performance and scalability, open source databases, 64-bit Linux and tips and tricks You may RSVP to this event at: https://ww4.premconf.com/webrsvp/register?conf_id=875614 Chat replays at: http://www-1.ibm.com/partnerworld/pwhome.nsf/weblook/eac_index_biz25aug.html