Download
1 / 3
30 likes | 201 Views
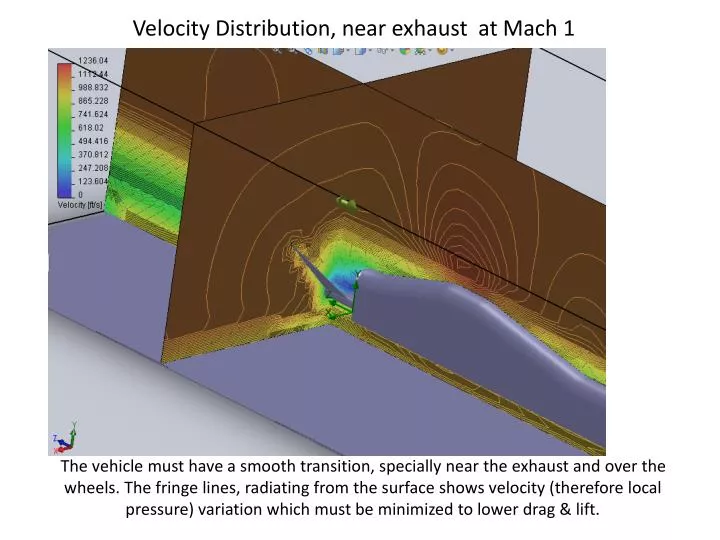
Velocity Distribution, near exhaust at Mach 1. The vehicle must have a smooth transition, specially near the exhaust and over the wheels. The fringe lines, radiating from the surface shows velocity (therefore local pressure) variation which must be minimized to lower drag & lift.

E N D
Velocity Distribution, near exhaust at Mach 1 The vehicle must have a smooth transition, specially near the exhaust and over the wheels. The fringe lines, radiating from the surface shows velocity (therefore local pressure) variation which must be minimized to lower drag & lift.
Pressure Distribution at the tipat Mach 1 The goal is to reduce pressure variation over the entire length of the body during the run. Pressure at the tip (above) varies from 11-22 Psi
Results: • Drag Coef. (Including results of ground effect) was calculated to be 1.12 • Center of Pressure (Cp) is 0.31 x L from the tip, where L = total length of • “Waldo mobile” • 3. Total force along the longitudinal axis: 8300 Lbs • 4. No of shocks creates = 3 • Lift = - 3400 Lbs at CP when sonic