Download
1 / 16
160 likes | 241 Views
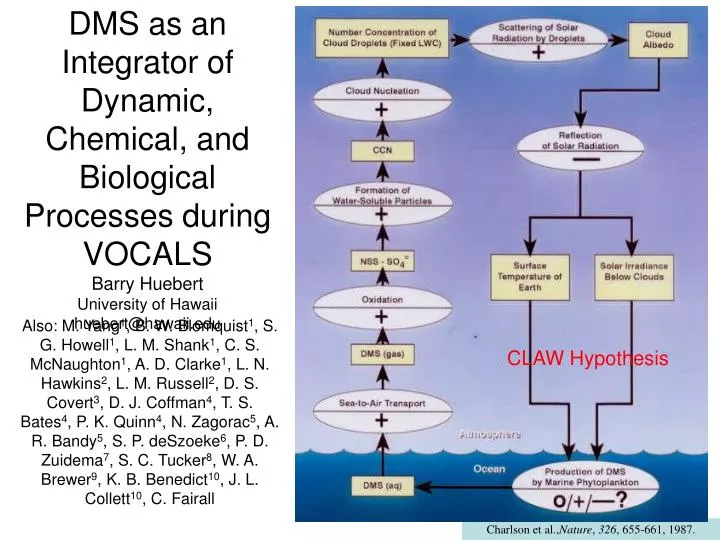
DMS as an Integrator of Dynamic, Chemical, and Biological Processes during VOCALS Barry Huebert University of Hawaii huebert@hawaii.edu.

E N D
DMS as an Integrator of Dynamic, Chemical, and Biological Processes during VOCALS Barry Huebert University of Hawaii huebert@hawaii.edu Also: M. Yang1, B. W. Blomquist1, S. G. Howell1, L. M. Shank1, C. S. McNaughton1, A. D. Clarke1, L. N. Hawkins2, L. M. Russell2, D. S. Covert3, D. J. Coffman4, T. S. Bates4, P. K. Quinn4, N. Zagorac5, A. R. Bandy5, S. P. deSzoeke6, P. D. Zuidema7, S. C. Tucker8, W. A. Brewer9, K. B. Benedict10, J. L. Collett10, C. Fairall CLAW Hypothesis Charlson et al.,Nature, 326, 655-661, 1987.
Can We Integrate Up The CLAW Hypothesis? Not Even Close!! So why even try to quantify fluxes and conversion rates? Charlson et al.,Nature, 326, 655-661, 1987. ? CCN / m2 d ? It is of great value to know the direction and magnitude of process changes in a different climate ~1.4 µmol / m2 d ~3 µmol / m2 d
1. Atmospheric Chemistry: Reaction Rates, Branching Ratios Average Effective [OH] was Derived from DMS Fluxes during VOCALS Continuity Equation Oct/Nov Average: [OH] = 1.5 x 10⁻⁶ cm-3 Noontime Peak: [OH] = 5 x 10⁻⁶ cm-3 Yang, Blomquist, Huebert (2009), Atmos. Chem. Phys., 9, 9225-9236.
2. Natural vs LRT Sulfur Fluxes to Remote Regions – Sulfur Budget From PASE – Pollution vs Natural Sulfur? PASE Average: Poll’n S ≅ DMS S Intermittent ≅ Continuous What about VOCALS? Measured Measured Measured Measured Vd = 0.4cm/s R. Simpson MS Thesis, UH, 2010.
2. Natural vs LRT Sulfur Fluxes to Remote Regions What was the Main Sulfur Source for nss-Aerosolsduring VOCALS? - Zonal Averages along 20°S (except RF-14 from the C-130) DMS and SO2 Concentrations Away from the coast, DMS Sea-to-air flux >> SO2 entrainment flux On average anthropogenic SO2 had virtually no impact on off-shore MBL Sulfur DMS and SO2 Fluxes Yang, MX, PhD Dissertation, Dept Oceanography, UHawaii, 2010.
Nighttime oxidation small Horizontal advection small No chemical production Time rate of change ≈ 2.6 mol m-2 day-1 Entrainment flux ≈ (3.3 - 2.6) = 0.7 mol m-2 day-1 Sea-to-air flux measured by EC ≈ 3.3 mol m-2 day-1 No DMS above the inversion 3. Atmospheric Dynamics / Entrainment VelocitiesDMS showed a Clear Diurnal Cycle- allowing us to estimate entrainment velocity (e) DMS pptv VOCALS-average DMS shows a clear diurnal cycle, with maximum just after sunrise (built up from air-sea exchange) and minimum just before sunset (OH oxidation) e ≈ 5 mm sec-1 (agrees well with Wood and Bretherton 2004; Caldwell et al. 2005) Yang, Blomquist, Huebert (2009), Atmos. Chem. Phys., 9, 9225-9236.
Atmospheric Chemistry helps Constrain Dynamics SO2 Model Obs SO2: Model and Obs fit pretty well. Implied SO2 diel cycle, with oxidation from DMS being the principal source and in-cloud oxidation as the main sink. The implied cycle agrees well with observations until 1500 UTC, with measurements in the subsequent hours likely subject to greater spatial bias.
Atmospheric Chemistry helps Constrain Dynamics SO4 Model Obs Sulfate: Not so good Implied SO42- cycle assuming a well-mixed MBL. The observed diel cycle in SO42- is not captured by this calculation.
There is virtually no vertical gradient of SO2, so entrainment won’t change its concentration. SO4=, however, is being produced in cloud. It does not show up as aerosol in this profile because nearly all the BuL sulfate is tied up in cloud droplets. Does that BuL/cloud sulfate mix downward continuously? ?
Atmospheric Chemistry helps Constrain Dynamics Sulfate with Post-sunset Re-coupling: Not bad Implied SO42- cycle assuming a well-mixed MBL at night and decoupled MBL during the day. SO42- produced in-cloud is summed over the entire day and only added to the MBL budget over the first four hours after sunset as the MBL re-couples. The implied cycle qualitatively agrees with shipboard.
4. Physics of Air-Sea Gas Exchange – DMS Observations Our five kDMS data sets (VOCALS is Green) lie very close to the NOAA-COARE Model Line A B Uncorrected Corrected for: Atmos Stability, Sc(T), Solubility(T), Relative wind dir, DMSw variation k660 tends to increase with SST as noted by Marandino et al. (2008) Yang, et al. (2010), Air-sea Exchange of Dimethylsulfide (DMS) in the Southern Ocean – Measurements from SO GasEx Compared to Temperate and Tropical Regions, SO GasEx Issue, J. Geophys Res., in revision.
5. Marine Biogeochemistry & the Natural Sulfur Source 6-7x spikes in [DMSw] 5-6x spikes in DMS flux 6-7x spikes in [DMSa] Surprisingly coherent atmospheric variability [DMSa] not smeared out Eddies during VOCALS Atmos [DMS] DMS Flux Water [DMS] Dynamics drive Bio-Variability which drives Atmos-Variability – All on the same scales! 75W 80W Yang, MX, PhD Dissertation, Dept Oceanography, UHawaii, 2010.
Entrainment of FT Tracers into the MBL Assume a box of MBL air: 1 km deep and 1 km sides Assume an entrainment velocity of 4 mm/s In one day, a 350 m deep layer of FT air will descend into the MBL Smaller Conc in FT 350 m FT Air Larger Conc in MBL MBL Air 1 km 1 km 1 km
Entrainment of FT Air into the MBL In one day, a 350 m deep layer of FT air will descend into the MBL That layer of FT air will bring with it all the tracer molecules it contains. This is a downward flux, independent of the MBL concentration of the tracer. Front 1 km MBL Air 1 km 1 km 350 m 1 km Front
Entrainment of FT Air and Tracers into the MBL The Entrainment Flux depends only on S+ Its impact on MBL Concentrations depends on (S+ - S-) Trace materials move with the air. The entrainment tracer flux equals the volume of air times its FT concentration: F = VEntr [tracer/volume] The MBL tracer concentration does NOT affect this flux Front 1 km MBL Air 1 km 1 km 350 m 1 km Front
Summary – EC-Measured Fluxes Clarify: • Atmos Chem Budgets and Ambient Reaction Rates • Natural Sources vs LRT/Pollution Sources • Atmospheric Dynamics & Entrainment Velocities • The Physics of Air-Sea Gas Exchange • Biogeochemical Processes • And • Knowing the functional form (physics) of each process gives us a basis for computing sensitivities to each controlling environmental variable. Thanks to NSF Atmospheric Chemistry for supporting the shipboard flux measurements.