Download

1 / 38
420 likes | 707 Views
Support Vector Machines. Peter Fox Data Analytics – ITWS-4963/ITWS-6965 Week 10a, April 1 , 2014. Support Vector Machine. Conceptual theory, formulae… SVM - general (nonlinear) classification , regression and outlier detection with an intuitive model representation

E N D
Support Vector Machines Peter Fox Data Analytics – ITWS-4963/ITWS-6965 Week 10a, April 1, 2014
Support Vector Machine • Conceptual theory, formulae… • SVM - general (nonlinear) classification, regression and outlier detection with an intuitive model representation • Hyperplanes separate the classification spaces (can be multi-dimensional) • Kernel functions can play a key role
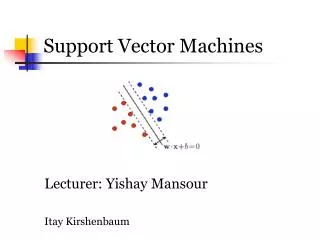
Schematically http://en.wikipedia.org/wiki/File:Svm_separating_hyperplanes_(SVG).svg
Schematically Support Vectors b=bias term, b=0 (unbiased) http://en.wikipedia.org/wiki/File:Svm_max_sep_hyperplane_with_margin.png
Construction • Construct an optimization objective function that is inherently subject to some constraints • Like minimizing least square error (quadratic) • Most important: the classifier gets the points right by “at least” the margin • Support Vectors can then be defined as those points in the dataset that have "non zero” Lagrange multipliers*. • make a classification on a new point by using only the support vectors – why?
Support vectors • Support the “plane”
What about the “machine” part • Ignore it – somewhat leftover from the “machine learning” era • It is trained and then • Classifies
No clear separation = no hyperplane? Soft-margins… Non-linearity or transformation
Feature space • Mapping (transformation) using a function, i.e. a kernel • goal is – linear separability
Kernels or “non-linearity”… http://www.statsoft.com/Textbook/Support-Vector-Machines the kernel function, represents a dot product of input data points mapped into the higher dimensional feature space by transformation phi + note presence of “gamma” parameter
pairs(iris[1:4], main = "Anderson's Iris Data -- 3 species”, pch= 21, bg = c("red", "green3", "blue")[unclass(iris$Species)])
Swiss - pairs pairs(~ Fertility + Education + Catholic, data = swiss, subset = Education < 20, main = "Swiss data, Education < 20")
Remember this one? How would you apply SVM here?
Outlier detection • SVMs have also been extended to deal with the problem of novelty detection (or one-class classification) • Detection works by creating a spherical decision boundary around a set of data points by a set of support vectors describing the sphere’s boundary
Multiple classification • In addition to these heuristics for extending a binary SVM to the multi-class problem, there have been reformulations of the support vector quadratic problem that deal with more than two classes • One of the many approaches for native support vector multi-class classification works by solving a single optimization problem including the data from all classes (spoc-svc)
Iris – svm - Karatzoglouet al. 2006
kernlab, svmpath and klaR • http://escience.rpi.edu/data/DA/v15i09.pdf • Work through the examples – how did these go? • Familiar datasets and samples procedures from 4 libraries (theseare the most used) • kernlab • e1071 • svmpath • klaR Karatzoglouet al. 2006
Application of SVM • Classification, outlier, regression… • Can produce labels or probabilities (and when used with tree partitioning can produce decision values) • Different minimizations functions subject to different constraints (Lagrange multipliers) • Observe the effect of changing the C parameter and the kernel See Karatzoglou et al. 2006
Types of SVM (names) • Classification SVM Type 1 (also known as C-SVM classification) • Classification SVM Type 2 (also known as nu-SVM classification) • Regression SVM Type 1 (also known as epsilon-SVM regression) • Regression SVM Type 2 (also known as nu-SVM regression)
More kernels Karatzoglouet al. 2006
Timing Karatzoglouet al. 2006
Library capabilities Karatzoglouet al. 2006
Ozone > library(e1071) > library(rpart) > data(Ozone, package=“mlbench”) > ## split data into a train and test set > index <- 1:nrow(Ozone) > testindex <- sample(index, trunc(length(index)/3)) > testset <- na.omit(Ozone[testindex,-3]) > trainset<- na.omit(Ozone[-testindex,-3]) > svm.model <- svm(V4 ~ ., data = trainset, cost = 1000, gamma = 0.0001) > svm.pred <- predict(svm.model, testset[,-3]) > crossprod(svm.pred - testset[,3]) / length(testindex) See: http://cran.r-project.org/web/packages/e1071/vignettes/svmdoc.pdf
Glass library(e1071) library(rpart) data(Glass, package="mlbench") index <- 1:nrow(Glass) testindex <- sample(index, trunc(length(index)/3)) testset <- Glass[testindex,] trainset <- Glass[-testindex,] svm.model <- svm(Type ~ ., data = trainset, cost = 100, gamma = 1) svm.pred <- predict(svm.model, testset[,-10]) rpart.model <- rpart(Type ~ ., data = trainset) rpart.pred <- predict(rpart.model, testset[,-10], type = "class”)
> table(pred = svm.pred, true = testset[,10]) true pred 1 2 3 5 6 7 1 12 9 1 0 0 0 2 6 19 6 5 2 2 3 1 0 2 0 0 0 5 0 0 0 0 0 0 6 0 0 0 0 1 0 7 0 1 0 0 0 4
kernlab • http://escience.rpi.edu/data/DA/svmbasic_notes.pdf • Some scripts: Lab9b_<n>_2014.R
Example 1 n <- 150 # number of data points p <- 2 # dimension sigma <- 1 # variance of the distribution meanpos <- 0 # centre of the distribution of positive examples meanneg <- 3 # centre of the distribution of negative examples npos <- round(n/2) # number of positive examples nneg <- n-npos # number of negative examples # Generate the positive and negative examples xpos <- matrix(rnorm(npos*p,mean=meanpos,sd=sigma),npos,p) xneg <- matrix(rnorm(nneg*p,mean=meanneg,sd=sigma),npos,p) x <- rbind(xpos,xneg) # Generate the labels y <- matrix(c(rep(1,npos),rep(-1,nneg))) # Visualize the data plot(x,col=ifelse(y>0,1,2)) legend("topleft",c('Positive','Negative'),col=seq(2),pch=1,text.col=seq(2))
Train/ test ntrain <- round(n*0.8) # number of training examples tindex <- sample(n,ntrain) # indices of training samples xtrain <- x[tindex,] xtest <- x[-tindex,] ytrain <- y[tindex] ytest<- y[-tindex] istrain=rep(0,n) istrain[tindex]=1 # Visualize plot(x,col=ifelse(y>0,1,2),pch=ifelse(istrain==1,1,2)) legend("topleft",c('Positive Train','PositiveTest','NegativeTrain','Negative Test'),col=c(1,1,2,2), pch=c(1,2,1,2), text.col=c(1,1,2,2))
Example 2 svp <- ksvm(xtrain,ytrain,type="C-svc", kernel='vanilladot', C=100,scaled=c()) # General summary svp # Attributes that you can access attributes(svp) # did you look? # For example, the support vectors alpha(svp) alphaindex(svp) b(svp) # remember b? # Use the built-in function to pretty-plot the classifier plot(svp,data=xtrain) > # For example, the support vectors > alpha(svp) [[1]] [1] 71.05875 28.94125 100.00000 > alphaindex(svp) [[1]] [1] 10 74 93 > b(svp) [1] -17.3651
ALL dataset (was dropped) • http://www.stjuderesearch.org/site/data/ALL1/
R-SVM • http://www.stanford.edu/group/wonglab/RSVMpage/r-svm.tar.gz • http://www.stanford.edu/group/wonglab/RSVMpage/R-SVM.html • Read/ skim the paper • Explore this method on a dataset of your choice, e.g. one of the R built-in datasets
Reading some papers… • They provide a guide to the type of project report you may prepare…
Assignment to come… • Assignment 7: Predictive and Prescriptive Analytics. Due ~ week ~11. 20%..
Admin info (keep/ print this slide) • Class: ITWS-4963/ITWS 6965 • Hours: 12:00pm-1:50pm Tuesday/ Friday • Location: SAGE 3101 • Instructor: Peter Fox • Instructor contact: pfox@cs.rpi.edu, 518.276.4862 (do not leave a msg) • Contact hours: Monday** 3:00-4:00pm (or by email appt) • Contact location: Winslow 2120 (sometimes Lally 207A announced by email) • TA: Lakshmi Chenicheri chenil@rpi.edu • Web site: http://tw.rpi.edu/web/courses/DataAnalytics/2014 • Schedule, lectures, syllabus, reading, assignments, etc.