Download
1 / 19
270 likes | 531 Views
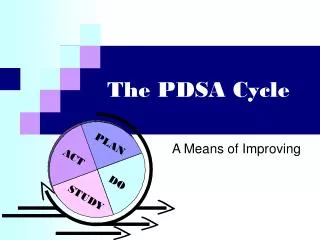
PLAN. ACT. DO. STUDY. The PDSA Cycle. A Means of Improving. “Doing Quality”. Six Sigma. Total Quality Management.

E N D
PLAN ACT DO STUDY The PDSA Cycle A Means of Improving
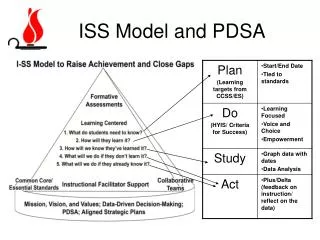
“Doing Quality” Six Sigma Total Quality Management • The activities by which an organization systematically and continuously evaluates the performance of key business processes, and works to improve those that produce outputs which are inconsistent with identified standards. • It’s a planned, comprehensive and ongoing endeavor. • It focuses on processes, not people. • It’s concerned with measurable indicators of quality. Quality Assurance Quality Improvement Process Improvement Statistical Process Control Performance Improvement Quality Assessment Continuous Quality Improvement
Then (1980’s) Quick fixes, based on hunches and “pet” ideas. “Thresholds” below or above which you let things ride. Delegated by leaders to the nerd in the basement office. Projects completed quickly (or not at all), with change sustained only as long as the whip got cracked. Now (2006) A structured approach to change, based on data. Continual improvement, based on the belief that things can always be made better. Promoted and practiced by leaders, who engage the rest of the organization. A long term endeavor that gives each improvement initiative the support it needs to succeed, and that builds the change into the culture. “Doing Quality” – A Look Across Time
A Primary Ingredient for Change DATA How will you know you’ve changed it if you haven’t measured it?
DATA DATA DATA DATA DATA DATA DATA DATA DATA The Process of Getting Better Improvement is a journey, not a destination.
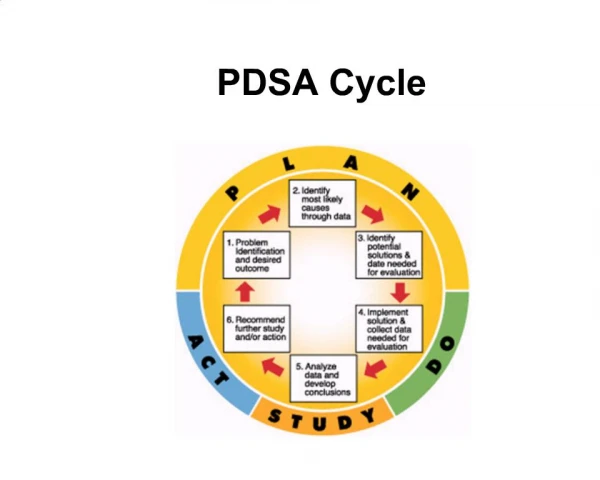
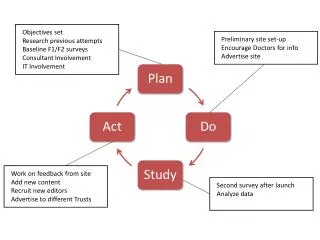
PLAN ACT DO STUDY PDSA: The Improvement Process IDENTIFY GOAL Opportunity to Improve Desired Outcome
Getting Started – The Sources of Inspiration • Required Measures • Ad Hoc Data Analysis • Consumer/Staff Feedback • Audit Findings • …And just looking around! IDENTIFY Opportunity to Improve
PLAN PLANNING: The First Step • What do you want to accomplish? • Think “Outcomes” not “Solutions” at this point. • How will you know when you’ve done it? • Identify specific parameters by which you will measure your progress toward the goal. GOAL Expressed in Measurable Terms
Decide Upon A Solution/Change • Identify the business processes involved. • If necessary, collect additional data to help focus your understanding of the issues. • Gather input from people who routinely work in, or experience, the processes. • Identify a course of action that appears feasible to carry out, and likely to produce the desired outcomes. Then…Plan a Pilot.
It’s the Process, Not the People • Process: A sequence of steps or actions carried out in order to provide a particular service and/or to deliver a specified outcome. • Planning involves: • Identifying the processes that are producing the results you want to change. • Defining the boundaries of each process. • Figuring out which parts of a process you want to alter, and how that may affect other parts of the process, or other processes. Processes deliver the outputs they are designed to deliver!
“It’s The Process” – A Somewhat Silly Example • Opportunity for Improvement: Suzanne is late to work 80% of the time. • Goal: Suzanne will begin working by 8:00 AM at least 95% of the time. • Processes: “Getting Ready for Work” and “Traveling To Work” • Process Boundaries: • Getting Ready for Work – First Step: Get out of bed; Last Step: Get in the car • Traveling to Work – First Step: Start the car; Last Step: Arrive at desk
Get out of bed Prepare dinner for evening; refrigerate it. Clean up and get dressed. Prepare and eat breakfast. Prepare lunch to take to work. Start the car. Drive to Starbucks Use the drive-up window to get a latte. Drive from Starbucks to office. Go to the break room to drink latte. Suzanne’s Processes • What measures of process performance might you collect data for before you decide where to make changes? • Given your understanding of Suzanne’s current processes, what changes might you recommend piloting? Getting Ready for Work Get in the car. Traveling To Work Arrive at desk.
Exercise: Name That Process • Instructions: • Work in groups of 2-3 • Name the processes that impact each measure on the worksheet. • Process names usually begin with a verb that ends in “ing,” (e.g., Doing an Intake, Authorizing a Service, Scheduling an Appointment, Documenting a Service, etc.) • Measures are usually impacted by more than one process. • For each measure, select one of the processes you named and identify its first and last steps, i.e., define the “process boundaries.”
Tips for A Successful “Plan” Phase • Take time to understand how the involved processes currently work, and why they are structured as they are. • If you need more data in order to understand the situation, take time to get it. • Take time to listen to people who actually work in the process, and to gather their ideas about how to get better results. • Take time to come up with more than one potential solution before settling on the solution to pilot. • Take time to develop an implementation plan that makes sense to those who will have to carry out the solution.
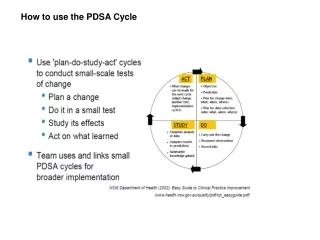
Statistical Tools Pareto Diagram Histogram Scatter Diagram Run Chart Control Chart Other statistics and forms of data presentation Non-Statistical Tools Process Flow Chart Cause/Effect Diagram Failure Modes and Effects Analysis Brainstorm Affinity Diagram Inter-relationship Diagram Prioritization Matrices Activity Network Diagram Tools for the “Plan” Phase Many of these tools also come in handy during the “Study” phase of the cycle.
Begin by making sure that people understand why a change is needed, and how to implement the solution to be piloted. Present the timelines for implementing the pilot and assessing its success. Monitor the progress of the pilot project. Don’t just “tell and run.” Assign a “champion” with whom staff can work to resolve implementation glitches. Make sure the data you’ll need to evaluate success is collected. DOING: Piloting Your Solution
Did you get any surprises? Did you make any messes? Did you get where you wanted to go? In hindsight, what are the pro’s and con’s of your solution? Now that you’ve tried it, do you believe this change can be sustained? What did you learn during the pilot? What do the data tell you about process performance after the change was implemented? What do staff/consumers have to say about how well the solution worked? STUDYING: Did It Work?
If the change you piloted was successful: Publicize your success. Take whatever steps are necessary to formalize the change. If the change you piloted did not create the desired outcomes: Share the results. Gather feedback from staff and consumers who participated in the pilot. Use the lessons learned to formulate a new solution to pilot. ACTING: The Next Steps Don’t give up! Improvement is a journey, not a destination.
PLAN ACT DO STUDY PDSA: A Review IDENTIFY GOAL Opportunity to Improve Desired Outcome