Download
1 / 22
220 likes | 392 Views
Additional Data Evaluation of the Daphnia Toximeter and its Benefits. Arco Wagenvoort & Corina Carpentier AquaLife Workshop, Kiel, Germany 31 st May 2010. Introduction. History of alarm detectors Evaluation in addition to Hinkley and Gradient detectors insight into types of changes

E N D
Additional Data Evaluation of the Daphnia Toximeter and its Benefits Arco Wagenvoort & Corina Carpentier AquaLife Workshop, Kiel, Germany 31st May 2010
Introduction History of alarm detectors Evaluation in addition to Hinkleyand Gradient detectors insight into types of changes Examples of advanced data evaluation and assessment of alarm situations
History: The Daphnia Test Alarm: activity below lower alarm threshold Upper alarm threshold unusable: drift, insensitive
Improvements Daphnia TestALARM: activity below lower alarm threshold Upper alarm threshold unusable: drift, insensitive 1994 - introduction of Hinkley detectorALARM: response to sudden changes 1999 - introduction of two gradient detectorsrelatively slow rise or fall in parameter values
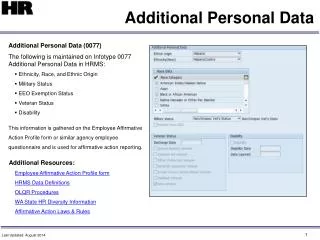
Data evaluation based on changes compared to previous data-points De Hoogh-Carpentier et al. (2006) and Wagenvoort et al. (2006): • standardisation and quality assurance protocols • introduction of size-based alarm thresholds and a mortality parameter to explain the “action mode” of chemicals (in use since 2004) ADVANCED DATA EVALUATION
Size-based data evaluation • Standardisation: use of animals of the same age (24 - 48 h) • Growth after (simultaneous) moulting • Larger animals showa greater swim speed range
Normal growth pattern of Daphnia Number of Daphnia Size of Daphnia
Growth: indicator for Daphniawell-being • Alarm situation at EijsdenMonitoring Station
Size-based data-evaluation: summary • Comparison to absolute values for swim speed • Early detection of technical malfunction(e.g. clogging of feeding tubes) • Indication of Daphnia well-being in general • Explanation of action mode of chemicals that cause alarms: • hyperactivity • paralysis
Example 2004/2005 : increased swim speed and mortality caused by 3-cyclohexyl-1,1-dimethylurea De Hoogh-Carpentier et al. (2006)
Example 2004/2005 : increased swim speed and mortality caused by 3-cyclohexyl-1,1-dimethylurea
Example 2007: increased swim speed and mortality caused by chlorpyrifos and diazinon Wagenvoort et al. (2010)
Determination of the end of an alarm The decrease in the Toxic Index does NOT mean that the alarm situation is over!
Example 2007: spill of chlorpyrifos and cypermethrin in River Meuse by Chimac-Agriphar near Liege Mortality of replaced Daphnia
Advanced data evaluation: recent results from the River Meuse
Advanced data evaluation for theRiver Meuse Period: Eijsden: 2007 Beegden: 2009 Keijzersveer: 2007-2009
Advanced data evaluation - summary • Results of the Daphnia Toximeter are reliable and reproducible • Quality assurance protocols reduce number of false positive alarms • Use of size-based alarm limits and individual parameter assessments provide: • earlier response • indication of action mode of chemicals • Evaluation method shows more alarms, but almost always the causes can be found
Thank you for your attention Acknowledgement: Colleagues at Eijsden, Beegden and Keizersveer Monitoring Stations in NL Arco Wagenvoort & Corina Carpentier AquaLife Workshop, Kiel, Germany 31st May 2010