Download
1 / 26
260 likes | 373 Views
Drought and Water Shortages: Looking Beyond the Climate Connection. Bradfield Lyon. International Research Institute for Climate and Society The Earth Institute at Columbia University Palisades, NY. What About Water? A Reality Check for the 21 st Century

E N D
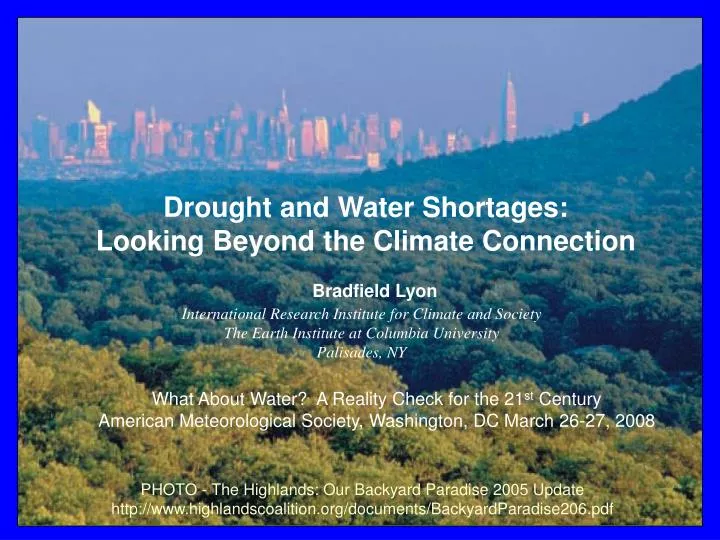
Drought and Water Shortages: Looking Beyond the Climate Connection Bradfield Lyon International Research Institute for Climate and Society The Earth Institute at Columbia University Palisades, NY What About Water? A Reality Check for the 21st Century American Meteorological Society, Washington, DC March 26-27, 2008 PHOTO - The Highlands: Our Backyard Paradise 2005 Update http://www.highlandscoalition.org/documents/BackyardParadise206.pdf
The Study Region Map: University of Connecticut • The Highlands (NY & NJ) • Population ≈ 1.5 million • Direct source of water • for ≈ 4.5 million people • 125,000 acres part of the NYC • water supply watershed
The “Water Abundant” Northeastern US Average Annual Precipitation (mm) Annual PRCP Coefficient of Variation Annual Precipitation Coefficient of Variation
Drought in the Hudson Valley over the past Century (Palmer Drought Severity Index, PDSI) 60’s DRY WET PDSI New York Climate Divisions Figure from CPC Data: NCDC Climate Division dataset served by IRI Data Library
Rockland’s Water Supply System Lyon et al. 2005, JAWRA
A Mismatch in Planning: Water Supply vs. Demand Water Supply (Private Company) Drought Development Local Municipalities, County Government Shortages CLIMATE
Hudson Valley Drought Indices (1950-2006) “2002 Drought” WET PDSI DRY WET 6-month precipitation anomaly DRY 12-month precipitation anomaly WET DRY
All Droughts lasting >4 months, 1900-2003 Hudson Valley Recent Droughts in Historical Perspective... PDSI for Hudson Valley 1950 to 2006 Lyon et al. 2005, JAWRA
All Droughts lasting >4 months, 1900-2003 Hudson Valley Recent Droughts in Historical Perspective... PDSI for Hudson Valley 1950 to 2006 Tree Ring Data: Cook, E.R. and P.J. Krusic. 2004. The North American Drought Atlas. Lamont-Doherty Earth Observatory and the National Science Foundation. Lyon et al. 2005, JAWRA
Rockland’s Vulnerability to Short Duration Droughts Average Occurrence of Meeting Precipitation Criteria for Declaring Different Stages of Drought Emergency Based on Historical (1880 – 2000) Data * Lyon et al. JAWRA, 2005
A Heavy Reliance on Ground Water New York-New Jersey Highlands Regional Study: 2000 Update (USDA Forest Service, 2002)
Increasing Population, Increasing Demand ≈ 25% New York-New Jersey Highlands Regional Study: 2000 Update (USDA Forest Service, 2002) Lyon et al. 2005, JAWRA
Supply Solution? Desalination of Hudson River Water United Water to Build $79 Million Desalination Plant on Hudson River to Meet County’s Long Term Water Supply Requirements http://www.unitedwater.com/uwny/PressRelease.asp?ReleaseID=487
Situation not Unique to Rockland County NJ PDSI Climate Division Average Recent Statewide Voluntary Water Restrictions Requested in NJ September, 2005 May, 2006 Upper-Right Figure Source: Beyond the Drought: New Jersey Faces a Long-Range Water Supply Crisis http://www.njreporter.org/NJR200206/njr_drought2.html
US General Accounting Office Study, 2003 USGS Estimated Use of Water in the United States in 2000 Extent of State Shortages Likely over the Next Decade Under Average Water Conditions Intensity of Water Use (withdrawal rate per unit area) http://www.gao.gov/cgi-bin/getrpt?GAO-03-514 http://pubs.usgs.gov/circ/2004/circ1268/
Summary Significant development coupled with a stagnant water supply capacity have made Rockland County increasingly vulnerable to inevitable emergence of periods of drought (in the hydrometeorological sense). Development projects have largely been under the purview of local municipalities and the county government, while the county’s water supply has largely been under the management of a private water company. This has led to “blame the other side” political posturing during periods of drought. The climate has, until recently, been a convenient scapegoat for both sides should water restrictions be imposed. The recent drought emergencies in Rockland were associated with climate fluctuations that were well within the range of historical variability - i.e., not a reflection of climate change. The region in fact has upward trends in temperature and precipitation. However, an increasing amount of precipitation is from extreme events which are not as conducive to groundwater recharge, and increasing temperatures lead to both higher consumptive use of water by humans as well as an increased atmospheric demand. The water situation in Rockland County is a microcosm of water issues throughout the “water abundant” (north)eastern US.
MAM Hudson Valley Precipitation by Season New York Climate Division 5 11-yr Moving Avg. JJA SON DJF
An Increasing Number of Extreme Precipitation Events Indicators of Climate Change in the Northeast 2005 http://cleanair-coolplanet.org/information/pdf/indicators.pdf
Climate Trends in the Hudson Valley Upward trends in temperature and precipitation have opposite effects on drought... Graphics Source: New England Integrated Sciences and Assessment, http://neisa.unh.edu/Climate/AnnualTemperature.html
* * * * NORTH * Recent Droughts Source: USGS http://ny.water.usgs.gov/projects/dialer_plots/saltfront.html#HDR3
Water Consumption and per capita Use in New York City Data Source: NYC DEP
NY DEC The Four Drought Stages and What They Mean The Drought Plan describes the actions to be taken during each drought stage by water purveyors, towns and villages, water authorities, and other agencies with water supply responsibilities. Drought Watch - The least severe of the stages, a drought watch is declared when a drought is developing. Public water suppliers begin to conserve water and urge customers to reduce water use. Drought Warning - Voluntary water conservation is intensified. Public water suppliers and industries update and implement local drought contingency plans. Local agencies make plans in case of emergency declaration. Drought Emergency - The Governor may declare emergency. The Disaster Preparedness Commission coordinates response. Mandatory local/county water restrictions may be imposed. Communities may need to tap alternative water sources to avoid depleting water supplies, protect public health and provide for essential uses. Drought Disaster - Disaster plans are implemented. Water use is further restricted. The Governor may declare disaster and request federal disaster assistance. Emergency legislation may be enacted. The state provides equipment and technical assistance to communities.
Pacific Institute http://www.pacinst.org/press_center/usgs/ http://pubs.usgs.gov/circ/2004/circ1268/