Download
1 / 1
10 likes | 180 Views
Spatial Data Access Tool (SDAT) Enable visualization and access of geospatial data using OGC services and Google Earth 1 Yaxing Wei, Suresh K. Santhana Vannan, Robert B. Cook , Bruce E. Wilson, Tammy W. Beaty

E N D
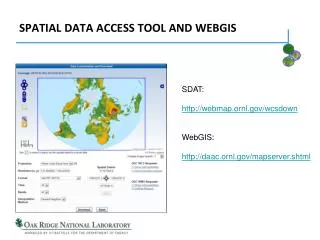
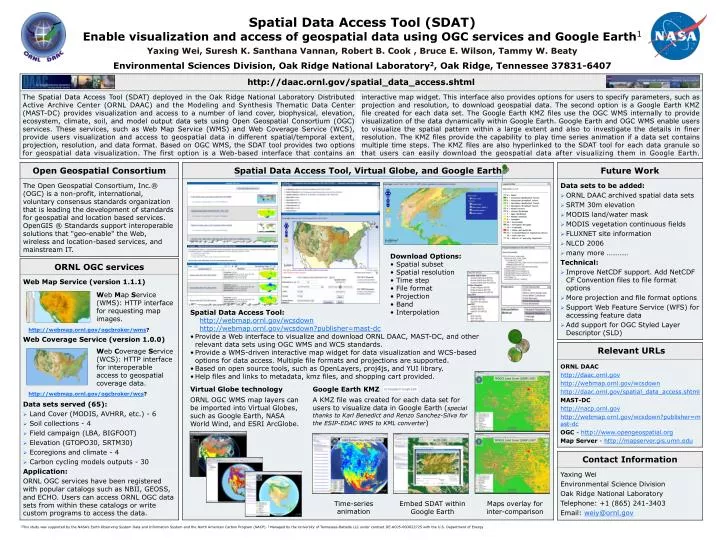
Spatial Data Access Tool (SDAT) Enable visualization and access of geospatial data using OGC services and Google Earth1 Yaxing Wei, Suresh K. Santhana Vannan, Robert B. Cook , Bruce E. Wilson, Tammy W. Beaty Environmental Sciences Division, Oak Ridge National Laboratory2, Oak Ridge, Tennessee 37831-6407 The Spatial Data Access Tool (SDAT) deployed in the Oak Ridge National Laboratory Distributed Active Archive Center (ORNL DAAC) and the Modeling and Synthesis Thematic Data Center (MAST-DC) provides visualization and access to a number of land cover, biophysical, elevation, ecosystem, climate, soil, and model output data sets using Open Geospatial Consortium (OGC) services. These services, such as Web Map Service (WMS) and Web Coverage Service (WCS), provide users visualization and access to geospatial data in different spatial/temporal extent, projection, resolution, and data format. Based on OGC WMS, the SDAT tool provides two options for geospatial data visualization. The first option is a Web-based interface that contains an interactive map widget. This interface also provides options for users to specify parameters, such as projection and resolution, to download geospatial data. The second option is a Google Earth KMZ file created for each data set. The Google Earth KMZ files use the OGC WMS internally to provide visualization of the data dynamically within Google Earth. Google Earth and OGC WMS enable users to visualize the spatial pattern within a large extent and also to investigate the details in finer resolution. The KMZ files provide the capability to play time series animation if a data set contains multiple time steps. The KMZ files are also hyperlinked to the SDAT tool for each data granule so that users can easily download the geospatial data after visualizing them in Google Earth. • Download Options: • Spatial subset • Spatial resolution • Time step • File format • Projection • Band • Interpolation Web Map Service (WMS): HTTP interface for requesting map images. • Spatial Data Access Tool: • http://webmap.ornl.gov/wcsdown • http://webmap.ornl.gov/wcsdown?publisher=mast-dc • Provide a Web interface to visualize and download ORNL DAAC, MAST-DC, and other relevant data sets using OGC WMS and WCS standards. • Provide a WMS-driven interactive map widget for data visualization and WCS-based options for data access. Multiple file formats and projections are supported. • Based on open source tools, such as OpenLayers, proj4js, and YUI library. • Help files and links to metadata, kmz files, and shopping cart provided. http://webmap.ornl.gov/ogcbroker/wms? Web Coverage Service (WCS): HTTP interface for interoperable access to geospatial coverage data. MODIS Land Cover (IGBP) 2001 Virtual Globe technology Google Earth KMZ http://webmap.ornl.gov/ogcbroker/wcs? ORNL OGC WMS map layers can be imported into Virtual Globes, such as Google Earth, NASA World Wind, and ESRI ArcGlobe. A KMZ file was created for each data set for users to visualize data in Google Earth (special thanks to Karl Benedict and Renzo Sanchez-Silva for the ESIP-EDAC WMS to KML converter) SiB3 Carbon Flux Monthly Data NLCD 2001 MODIS Land Cover (IGBP) 2007 Time-series animation Embed SDAT within Google Earth Maps overlay for inter-comparison 1This study was supported by the NASA’s Earth Observing System Data and Information System and the North American Carbon Program (NACP).2Managed by the University of Tennessee-Battelle LLC under contract DE-AC05-00OR22725 with the U.S. Department of Energy