Download
1 / 15
150 likes | 227 Views
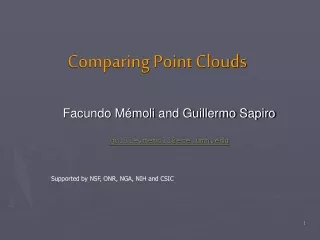
Consolidated Visualization of Enormous 3D Scan Point Clouds with Scanopy. Claus Scheiblauer 1 Michael Pregesbauer 2. 1 Institute of Computer Graphics and Algorithms, Vienna University of Technology, Austria 2 Government of Lower Austria, Austria. Screenshot. Scanning Project Area.

E N D
Consolidated Visualization of Enormous 3D Scan Point Clouds with Scanopy Claus Scheiblauer1 Michael Pregesbauer2 1Institute of Computer Graphics and Algorithms, Vienna University of Technology, Austria 2Government of Lower Austria, Austria
Screenshot Claus Scheiblauer
Scanning Project Area • Amphitheater 1, Bad Deutsch-Altenburg Claus Scheiblauer
Motivation • Excavation accompanying data acquisition • Documentation of the ancient amphitheatre • Creation of a 3D model of the whole amphitheatre Claus Scheiblauer
Scanning Project • Data aquisition between 2008 and 2010 • Laserscanner system Riegl LMS 420i • 120 scan positions • 106M points Claus Scheiblauer
Data Aquisition • Geocoding within a national global reference system • Coarse registration with tie points • Fine registration by using identical patches for a multi station adjustment • Scan position accuracy 1 - 2cm Claus Scheiblauer
Point Cloud • Rendering with weighted point size • One color per splat Claus Scheiblauer
Point Cloud • Rendering with weighted point size • One color per pixel Claus Scheiblauer
Averaging Colors • One color per splat • Arbitrary color borders • Color noise due to • Overlapping splats • Points from scan positions far away • One color per pixel • Pixel color is averaged from contributing splats • Reduced color noise Claus Scheiblauer
Gaussian Splats • Splat size is know • Screen aligned splats • Pixels are weighted accordingto distance from center • Gaussian distribution • At each pixel the colors from different splats are blended • According to their weight 0.4 Claus Scheiblauer
Gaussian Splats Blending • Only splats up to a certain depth distance should be blended • Some heuristic • Uniform sampled point clouds without noise • Distance = splat radius • Non uniform sampled with noise • Distance = some constant Claus Scheiblauer
Gaussian Splats Multipass • Splatting is divided into 3 passes • Depth pass • First a depth image is created • Attribute pass • Only visible points contribute color values • Colors are weighted and blended • Normalization pass • The colors are normalized at each pixel Claus Scheiblauer
Gaussian Splats Properties + Splat sizes that are “too big” give better result + Color noise is reduced + Features become more visible - Increased rendering time Claus Scheiblauer
Acknowledgements • FFG FIT-IT Projekt “Terapoints” • Government of Lower Austria • Imagination Computer Services Claus Scheiblauer
Live Demo • Amphitheatre 1 in Bad Deutsch-Altenburg • 106M points • 1.6 GB data on disk Claus Scheiblauer