Download

1 / 19
200 likes | 278 Views
Comparing Effectiveness of Top-Down and Bottom-Up Strategies in Containing Influenza. Achla Marathe, Bryan Lewis, Christopher Barrett, Jiangzhuo Chen, Madhav Marathe, Stephen Eubank, and Yifei Ma. PLoS ONE, Volume 6, Issue 9, e25149 September 2011. Outline. Motivation for the study

E N D
Comparing Effectiveness of Top-Down and Bottom-Up Strategies in Containing Influenza Achla Marathe, Bryan Lewis, Christopher Barrett, Jiangzhuo Chen, Madhav Marathe, Stephen Eubank, and Yifei Ma PLoS ONE, Volume 6, Issue 9, e25149 September 2011. Network Dynamics & Simulation Science Laboratory
Outline • Motivation for the study • Experiment settings • Experiment results
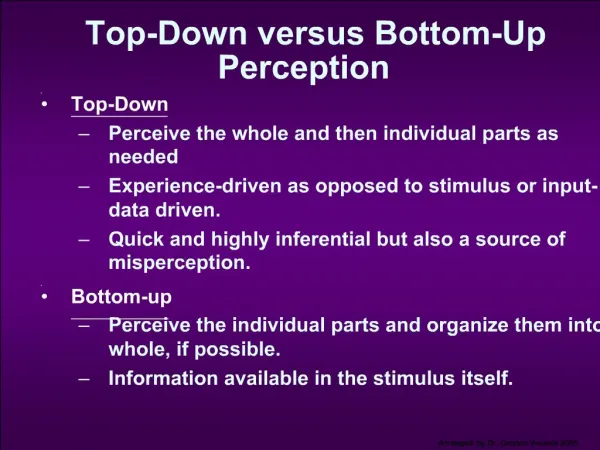
Comparison: Obvious Pros and Cons • Individual behavioral interventions – bottom-up • D1 (distance-1) intervention: each person takes intervention action when he observes outbreak among his direct contacts • Self motivated, prompt action • Better accuracy in observation (based on symptoms) • Lack of global knowledge; un-planned and un-targeted • Public health interventions – top-down • Block intervention: take action on all people residing in a census block if an outbreak is observed in the block • School intervention: take action on all students in a school if an outbreak is observed in the school • Planned/optimized based on global epidemic dynamics • Targeted (circumvent “hot-spots”) • More noise in observation (based on diagnosis); delay in case identifying/reporting • Mass action, delay in implementation, low compliance • Administration cost
Comparison: Effectiveness and Cost • Effectiveness of intervention: • Reduce attack rate (morbidity and mortality, productivity loss) • Delay outbreak/peak • Cost • Number of people involved in intervention • Pharmaceutical: consumption of antiviral or vaccines, which often have limited supply • Non-Pharmaceutical (social distancing): loss of productivity • Other cost: e.g. administration of a mass vaccination campaign
Experiment: A Factorial Design • Simulate epidemics in a US urban region with 3 different intervention strategies: D1, Block, School • 2 flu models: moderate flu with ~20% attack rate without intervention; catastrophic flu with ~40% attack rate without intervention • Probability of a sick case being observed (diagnosed and reported for top-down interventions): 2 observability values 1.0 and 0.3 • 2 threshold values for taking actions: 0.01 and 0.05 • Fraction of direct contacts found to be sick: D1 intervention • Fraction of block (school) subpopulation found to be sick: block (school) intervention • 2 compliance rates: 1.0 and 0.5 • 2 pharmaceutical actions • Antiviral administration (AV): usually available • Vaccination (VAX): delayed availability for new flu strains • Delay in implementing interventions (from deciding to take action): 2 values for Block and School, 1 day and 5 days; no delay for D1 • 2 x 2 x 2 x 2 x 2 x ( 2 + 2 + 1) = 160 cells • 25 replicates per cell (4000 simulation runs!)
Experiment: Other Settings • SEIR disease model: heterogeneous PTTS (probabilistic timed transition system) for each individual • Between-host propagation through social contact network on a synthetic population • Miami network: 2 million people, 100 million people-people contacts • Assume unlimited supply of AV or VAX • One course of AV is effective immediately for 10 days: reduce incoming transmissibility by 80% and outgoing by 87% • VAX is effective after 2 weeks but remains effective for the season • Simulation tools: EpiFast and Indemics developed in our group
Intervention Coverage: Moderate Flu with Various Interventions
Intervention Coverage: Catastrophic Flu with Various Interventions
Experiment Results: Antiviral • AV is very effective under D1 • Moderate flu: attack rate drops from 20% to <1%; catastrophic flu: from 40% to <1% • AV has almost no effect under two top-down strategies • Performance of bottom-up AV strategy is robust to delay in implementation, drop in compliance rate and increase in threshold value • High depletion of AV under top-down strategies • Top-down interventions avert <1 case per drug course • Bottom-up intervention averts up to 10 cases per drug course
Experiment Results: Vaccination • VAX performs best under Block strategy if sufficient number of vaccines were available • 2-week delay for becoming effective -> cases in one's immediate neighborhood become less relevant • decrease in attack rate: Block > D1 > School • (moderate flu) cases averted per drug course: D1 > School > Block • Performance of top-down strategies is not sensitive to 1 day or 5 day delay
Policy Implications Depending on public health policy goals and availability of antivirals and vaccines: • If disease is highly infectious and vaccines are available in abundant supply: Block strategy seems the best choice • If only antivirals are available and only in limited amount: maybe distribute them to private citizens on-demand or over-the-counter • If antivirals and vaccines are both available only in limited quantities, identification of infectious cases is administratively expensive, and compliance with a public policy is an issue: best to motivate individuals to self-intervene by applying D1
Closer look at an interesting setting… (catastrophic flu, high observability, low threshold, vaccines available)
Day-by-day Epidemic Evolution vs. Intervention Epidemic Intervention coevolution Catastrophic flu, 100% diagnosis, 1% threshold, 50% compliance; error bars at peak of each curve show standard deviation over 25 replicates
Cumulative Epidemic Evolution vs. Intervention Catastrophic flu, 100% diagnosis, 1% threshold, 50% compliance
Summary • An interesting comparison study • Individual behavioral vs. public health level interventions • Simulations policy implications • Unique capability to run such complex, realistic studies • Behavioral adaptation (endogenous and exogenous) + network model (individual level details) • Fast simulation tools